

Another Roaring 20s for U.S. Consumers
“Can’t repeat the past? Why, of course you can!”
Through years of lockdowns, re-openings, inflation and policy uncertainty, consumers have done unfathomably well at supporting the U.S. economy in the 2020s. We are now well into the latter half of a decade that began with an unprecedented household savings boost that resulted from the policy stimulus response to the pandemic. That stimulus has helped consumer spending stay resilient to the subsequent price shocks and bouts of real income stagnation that, in prior decades, likely would have derailed it.
2026 has been the latest in a string of testing years for U.S. consumers. Wage growth has slowed but financial wealth has never been higher. Inflation has shot up again thanks mainly but not entirely to Hormuz-related energy cost increases, helping keep interest rates higher than they would be otherwise. Even so, consumer spending growth annualized at an impressive 3.2% after inflation in the second quarter.
Perhaps no bit of popular culture epitomizes the American consumer’s determined spirit in its pure, unadulterated form as well as F. Scott Fitzgerald’s The Great Gatsby. Jay Gatsby, the mysterious gentleman who appears as if from nowhere, throws lavish parties, and can give no credible account of how his wealth came to him, is an atypical consumer, to be sure. But Gatsby and his Roaring Twenties crowd inform the enduring exceptionalism of the modern American consumer in ways that will inform theories and conclusions in this piece.
Just about everyone who has taken a high school English class has read Gatsby and knows how it ends. Rest assured our conclusions will not be nearly as bleak as the novel’s. We will cover the consumer from the perspective of sentiment (poor), housing (frozen), and wealth (increasing). Ultimately, we think it’s the last category that will determine how long the party lasts.
Consumers (Say They) Are Angry and Pessimistic
“I am one of the few honest people that I have ever known.”
Consumer sentiment is about as bad as it’s ever been. Professional surveys intended to measure consumers’ attitudes on the broad economy and their own personal finances have existed since the mid-20th century, meaning they capture the stagflation of the 1970s and the 2008 financial crisis. Yet one look at this graph from the University of Michigan shows that in two key categories, the outlook for personal finances and the labor market, Americans have rarely been more pessimistic than they are today:
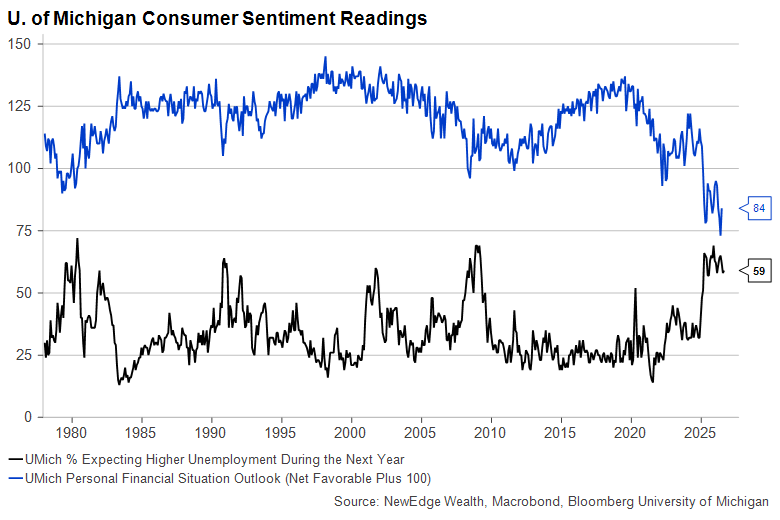
As of August 2026
Sentiment surveys have been good gauges of future spending behavior in past cycles. But the new trends of the 2020s remind us that as analysts of economic data we cannot simply “beat on, boats against the current” lest we be “borne back ceaselessly into the past.” Indeed, the trend of the past five years, as we hinted at in the introduction, has been for consumers to say one thing and do something else entirely:
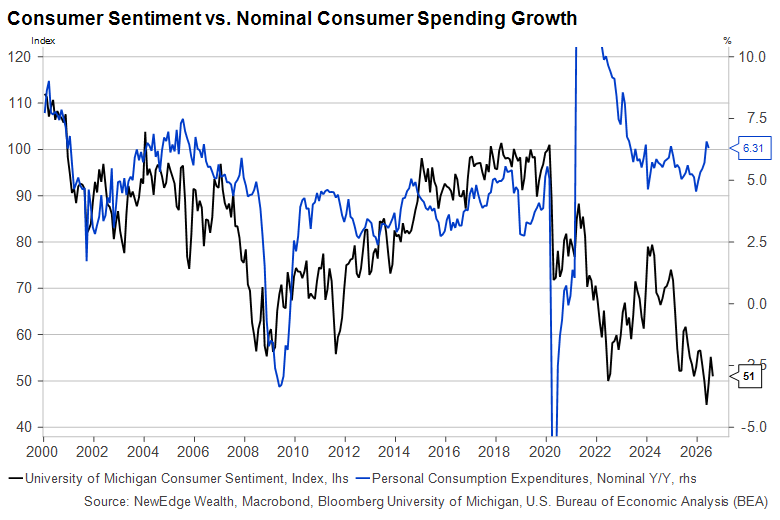
As of August 2026
This phenomenon has been examined ad nauseum, and we aren’t looking for the two lines on the graph above to converge anytime soon. As Nick Carraway wisely said, “reserving judgements is a matter of infinite hope.” Today, we are most interested in consumer behavior, not consumer attitudes. What is keeping spending afloat in such a challenging environment? Our next section dives into some of the headwinds, tailwinds and crosswinds consumers face.
The Pushes and Pulls on U.S. Consumers
“I was, within and without, simultaneously enchanted and repelled by the inexhaustible variety of life.”
Over time, consumer spending behavior has been inextricably linked to the labor market. When jobs are plentiful and paying well, consumers tend to have the means and the desire to spend more:
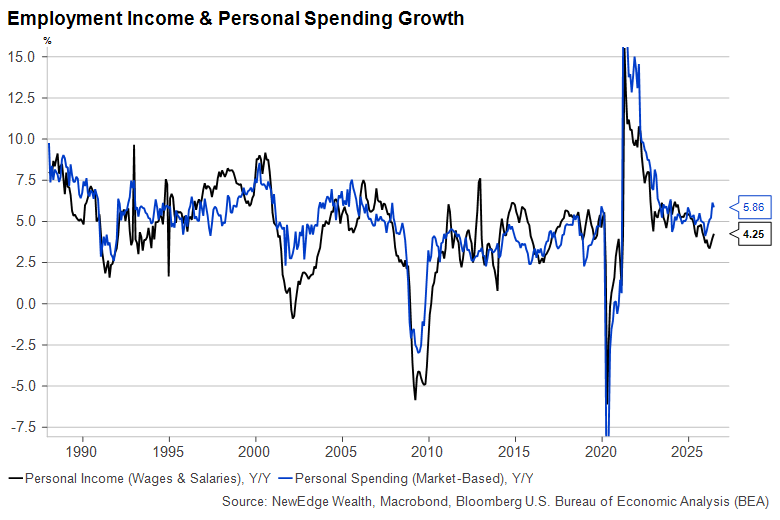
As of June 2026
In fact, consumers often save less of their take-home pay during good times, a sign that the decision to save or spend comes down more to financial security (“I feel richer and can spend more”) than it does to affordability (“I need to save less to afford the things I need”). Of course, in any economy there are examples of both phenomena, but a falling savings rate in a strong economy is a sign of high consumer confidence.
Currently, the combination of a booming stock market and the significant rise in home prices over the past six years has helped bring the savings rate to one of its lowest levels on record (note the savings rate and its axis are inverted on this graph):
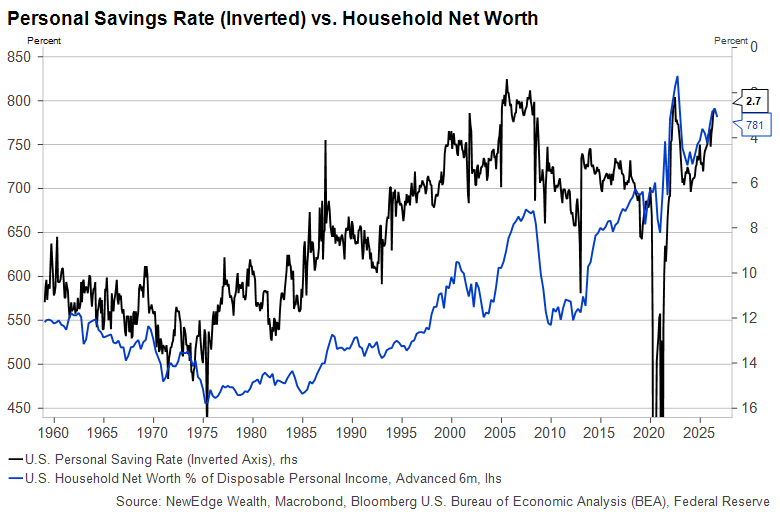
As of July 2026
This graph above shows the wealth effect in action, and it continues to drive spending growth for the large and growing segment of the population (i.e., retirees) who a) own their own home; b) have substantial financial wealth; and c) are not overly sensitive to inflation or labor market conditions.
The challenge of 2026 for consumers (and economists) has been that while the wealth effect continues to pull spending up, the income effect – especially when inflation is factored in – is putting more stress on a significant number of households. After recovering swiftly in 2023 and 2024, inflation is once again overtaking any growth in wages:
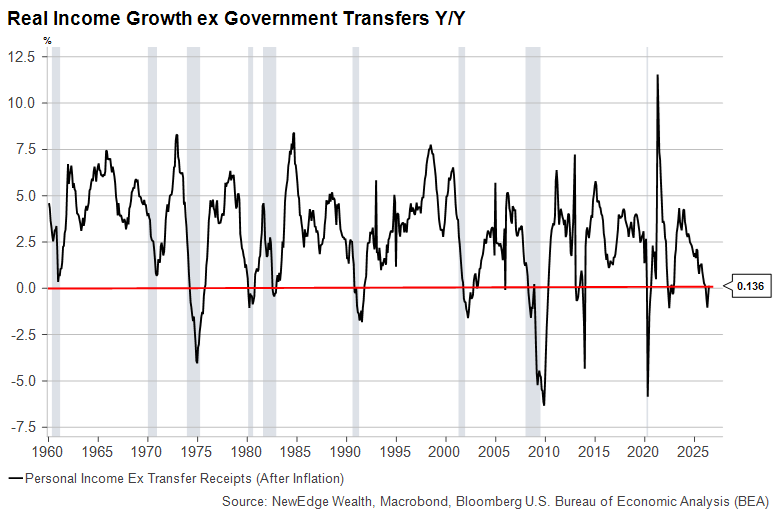
As of June 2026
It’s likely that the decline in personal savings this year is due both to wealthier households choosing to save less and lower income households needing to spend more on essential items like gasoline. But according to a recent survey of evidence by the Minneapolis Fed, there isn’t much evidence of a K-shaped pattern in spending. Households on all rungs of the income ladder are buying more goods and services – even controlling for inflation – than they were in 2019.
There is one other wrinkle to address here on the income side, and that is changes to the tax code that took effect this year. Many aspects of the One Big Beautiful Bill Act (OBBBA) were intended to boost after-tax incomes of lower wage workers such as those dependent on tips. Data from Bank of America shows an acceleration in after-tax incomes for lower-income workers, the first time we have seen this since the acute labor shortage following the pandemic:
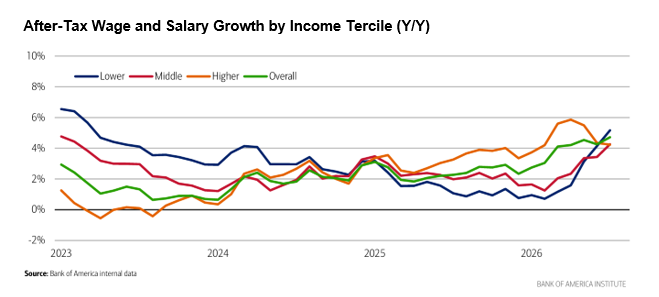
As of July 2026
Bank of America speculates that the OBBBA is responsible for a lot of this “catch up”, which may mean the effect is a one-off. But it may also be the case that stricter immigration enforcement and the resulting shrinking of the labor force has helped create a tighter labor market (i.e., employers having to pay up for scarcer workers), which could become more perpetual. BofA also points to an increase in job switching as a potential booster. We will address this point and the broader issue of household mobility in the next section.
High Interest Rates Are a Problem for Consumers
“It takes two to make an accident.”
We can certainly lay some of the blame for poor consumer sentiment on the recent bout of negative real income growth. But sentiment has been poor for this entire decade, even during years like 2023 and 2024 in which real income growth was strong. Something else is behind the sour mood out there, something bad enough to make consumers angry but not bad enough to stop them from spending. We think persistently high interest rates are contributing to the misery in multiple respects.
First, high interest rates have frozen the housing market. More specifically, the rapid transition from historically low interest rates (which allowed existing homeowners to refinance mortgages at unthinkably low rates) to higher rates (making many homes unaffordable given the simultaneous increase in prices) has produced historically low home sales.
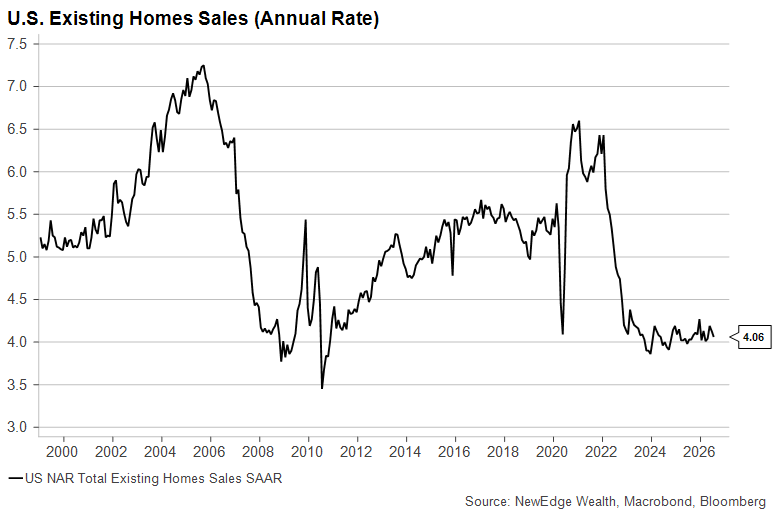
As of July 2026
Second, higher interest rates have not improved housing affordability by boosting the number of homes for sale, as they typically do. A few years after Fed tightening periods like the mid-2000s, enough economic discomfort normally builds up (through higher mortgage rate resets and higher unemployment) to force some homeowners to sell at discounted prices. But that isn’t happening, either:
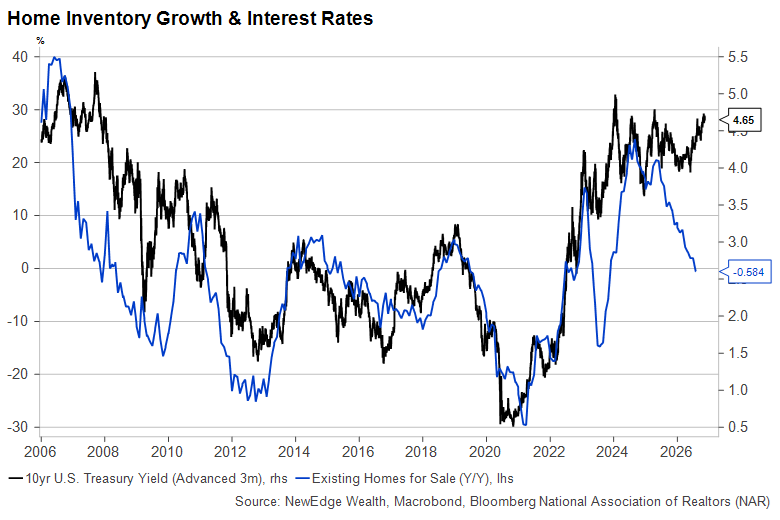
As of July 2026
The reason existing homeowners aren’t selling is that their monthly mortgage payments are very low for the size of the house in which they are living. Moving brings with it the prospect of living in a smaller home with a much higher mortgage rate, not an attractive prospect for most. The current generation of homeowners has learned the lessons of the 2008 financial crisis, but their wisdom has accrued at the expense of the next generation of homeowners.
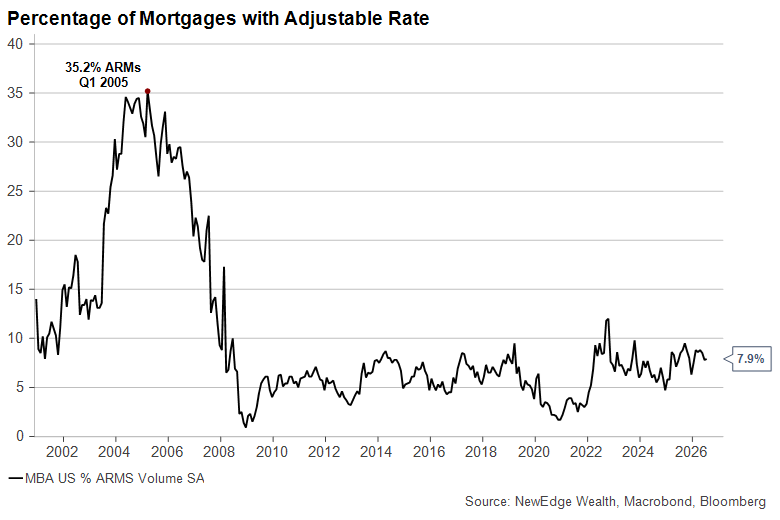
As of July 2026
Why does housing matter to consumers? Well, housing mobility is closely associated with job mobility, and job switching is historically linked with faster wage gains. That pattern has held in 2026 even with fewer job switchers than normal.
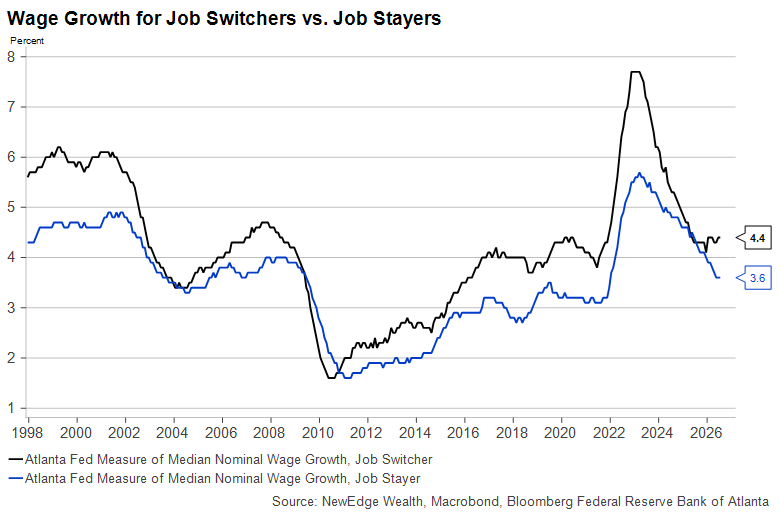
As of July 2026
We can see from the BLS’ monthly JOLTS data that job separations (including both voluntary quits and layoffs) and hiring both remain subdued.
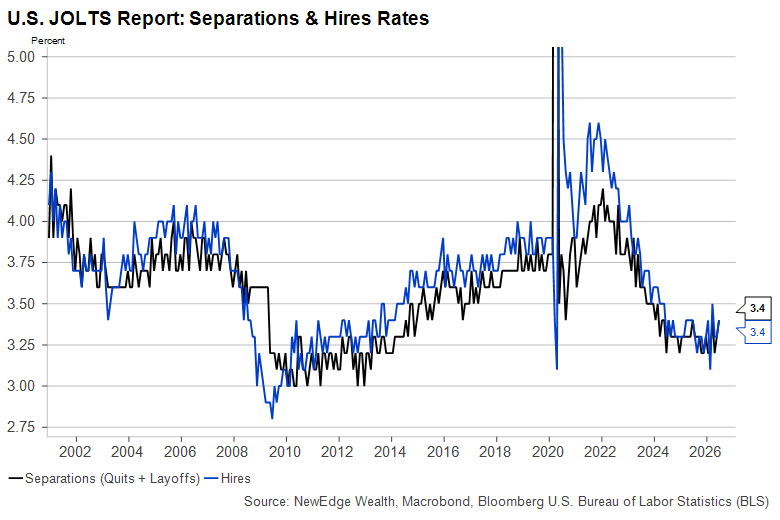
As of June 2026
Lack of mobility brings with it personal and financial frustrations, but it’s unlikely to have a crippling effect on spending behavior. In fact, current renters who are locked out of the housing market may feel they have more cash to spend since they aren’t worried about saving for an impending down payment. Even when housing and labor markets are cooling, spending can remain robust and savings rates can fall…as long as the stock market is going up. This brings us to our conclusion.
Conclusion
“They smashed up things and creatures and then retreated back into their money…and let other people clean up the mess they had made.”
So what? Consumers are unhappy, but they continue to spend. Most workers are making enough money, and those who aren’t are willing and able to save less or borrow to sustain their spending habits. They find it hard to move or switch jobs, but this may actually free up some disposable income they never counted on having. What’s the problem, here?
Ultimately, the problem is one of sustainability. Consider this chart of nominal GDP growth (the change in the value of all the goods and services produced in the U.S.) and total weekly payroll growth. Pay special attention to the recent divergence:
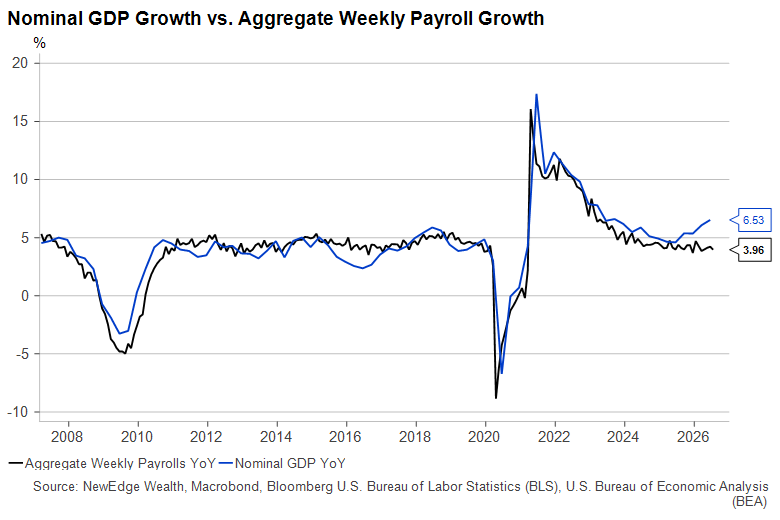
As of July 2026
Nominal GDP growth is a reasonable proxy for trend profits growth, while aggregate weekly payrolls represent the sum of all workers’ take-home pay. One is growing much faster than the other, and that’s unusual. Eventually, one of these two things will happen: payroll growth will accelerate to match nominal GDP growth (meaning some profits transfer to workers) or nominal GDP growth will decelerate through some combination of lower inflation (narrowing profit margins) or slower real growth, potentially with a drag from higher interest rates.
“So we drove on toward death through the cooling twilight.” All right, perhaps that’s a tad dramatic. But we subscribe to the adage that if something can’t go on forever, it won’t. Too many households are saving too little. Others are one more energy or food price shock away from cutting discretionary spending. Still more are delaying large purchases in the hope that borrowing costs may soon come down.
For now, consumers are smiling at us with “a quality of eternal reassurance.” And we don’t think households will be the first link in the economic chain to break in this cycle. As we wrote last week, slower corporate earnings growth, whenever it arrives, seems to us the largest risk to economic growth. Consumers remain sensitive to the equity market, to be sure, but they seem more than capable of supporting themselves and the economy so long as they feel wealthy enough to do so.
IMPORTANT DISCLOSURES
The views and opinions included in these materials belong to their author and do not necessarily reflect the views and opinions of NewEdge Capital Group, LLC.
This information is general in nature and has been prepared solely for informational and educational purposes and does not constitute an offer or a recommendation to buy or sell any particular security or to adopt any specific investment strategy.
NewEdge and its affiliates do not render advice on legal, tax and/or tax accounting matters. You should consult your personal tax and/or legal advisor to learn about any potential tax or other implications that may result from acting on a particular recommendation.
The trademarks and service marks contained herein are the property of their respective owners. Unless otherwise specifically indicated, all information with respect to any third party not affiliated with NewEdge has been provided by, and is the sole responsibility of, such third party and has not been independently verified by NewEdge, its affiliates or any other independent third party. No representation is given with respect to its accuracy or completeness, and such information and opinions may change without notice.
Investing involves risk, including possible loss of principal. Past performance is no guarantee of future results.
Any forward-looking statements or forecasts are based on assumptions and actual results are expected to vary from any such statements or forecasts. No assurance can be given that investment objectives or target returns will be achieved. Future returns may be higher or lower than the estimates presented herein.
An investment cannot be made directly in an index. Indices are unmanaged and have no fees or expenses. You can obtain information about many indices online at a variety of sources including: https://www.sec.gov/answers/indices.htm.
All data is subject to change without notice.
© 2026 NewEdge Capital Group, LLC
The post Why, Of Course You Can! appeared first on NewEdge Wealth.


