


So lately, been wondering
Who will be there to take my place?
When I’m gone, you’ll need love
To light the shadows on your face
“Wherever You Will Go”, The Calling
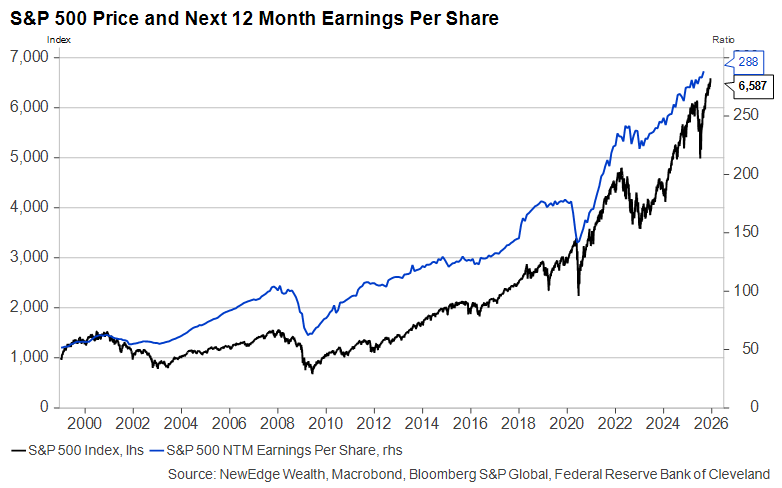
One of the most common questions we receive is how markets can trade to new all-time highs given recent weaker economic data and swirling policy uncertainty.
The answer has many important components, such as abundant global liquidity supporting elevated valuations (the S&P 500 at 22.6x forward, back to 2020 peak) and institutional positioning that remains merely “neutral” despite powerful US equity market returns (creating the conditions for the “pain trade” to be higher). But we think the most important driver of equity market strength is simply earnings.
In the most basic sense, as long as the 12-month forward earnings estimate for the S&P 500 is making new all-time highs, we should not be surprised to see the S&P 500 itself make new highs (equity index returns and earnings effectively recite The Calling’s one-hit-wonder to each other, saying “I’ll go wherever you will go”).
Of course, this basic statement that equity markets can make new highs as earnings estimates make new highs has a lot more complexity under the surface (unlike the shallow and callow music video for The Calling’s 2001 hit).
To Watch You, To Guide You: Assessing Consensus and Monitoring Revisions
We must begin by acknowledging that earnings are a lagging market indicator, meaning these sell-side consensus estimates tend to peak after market peaks and bottom after market bottoms.
This lagging nature requires us, if we want to use earnings as an input into our analysis, to analyze the likelihood that current consensus estimates will be met, beat, or missed, while also tracking the path of estimate revisions (are analysts raising or cutting forecasts).
This last point is important, as the path of estimate revisions for both earnings and broader US GDP is the key driver of market strength or weakness. GDP and earnings estimates moving higher supports risk appetite, which allows for valuation expansion, while estimates moving lower typically coincide with risk-off sentiment, which comes with the added hit of valuation compression.
This is why we have been calling the charts seen below “the most important charts of the last four years”.
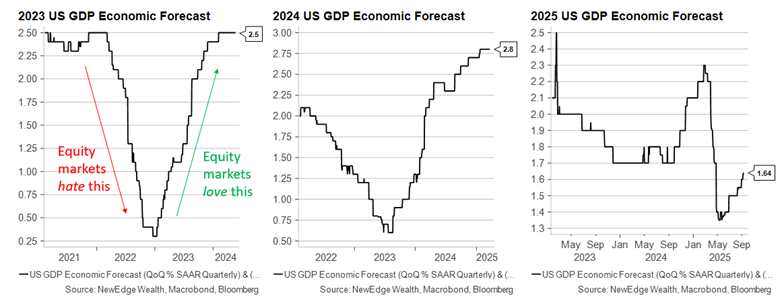
Risk assets swoon when estimates are getting cut and rejoice when estimates are getting raised, which brings us back to assessing the likelihood that current consensus estimates will be met.
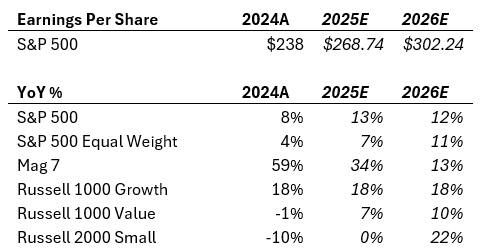
The table below shows the current Bloomberg consensus estimates for 2025 and 2026 S&P 500 earnings, along with the key components of those estimates, such as revenue growth and operating margins. You can observe that to get to the current consensus estimate of $302 in 2026, the S&P 500 needs to experience both a top-line growth acceleration and a whopping 166 bps of margin expansion to new all-time-high EBITDA margins of 23.4%.
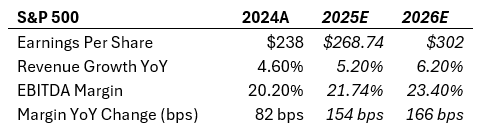
Further, analysts have been raising their forecasts in recent months for 2025 and 2026 earnings, after cutting estimates at the start of the year (again, these estimate revisions higher are a key reason for market strength).
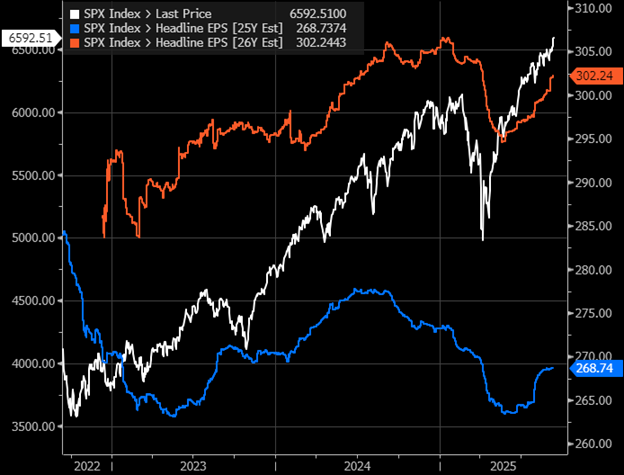
An aside: you may have noticed that both 2025 and 2026 earnings estimates remain below prior peaks, but that the 12-month forward estimate is at new highs. This is because the 12-month number is simply benefiting from the passage of time, as each day/week/month that goes by, more of the high-growth estimate for 2026 gets included in the 12-month number.
Following payroll data that showed weaker-than-expected job growth, we are questioning whether the 2026 expectations, showing 12% EPS growth, accelerating revenue growth, and strong margin expansion, are realistic in the context of a slowing macroeconomic backdrop. The U.S. economy has added only an average of 30,000 jobs per month over the past three months, and there are growing signs that corporate margins may come under pressure from tariffs.
“Way Up High, Or Down Low”: Magnificent 7 Earnings Dominance
Of course, the rebuttal to any doubt about the ability of equity markets to deliver earnings growth is that the market is not the economy and that the drivers of market earnings growth are far more idiosyncratic, driven by the massive investment cycle in AI.
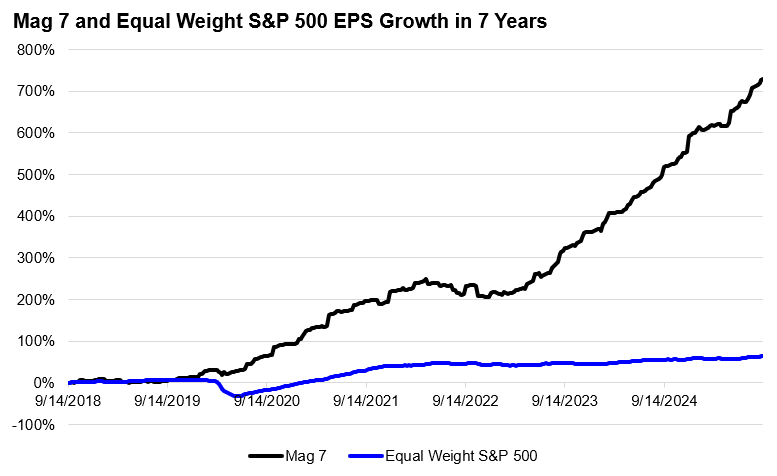
This has certainly been a powerfully accurate assertion since the pandemic. The chart below shows the earnings growth of the Magnificent 7 stocks compared to the Equal Weight S&P 500 over the past seven years. In an utterly impressive way, the Magnificent 7 has grown earnings by 730% in this time, compared to a relatively paltry 63% for the Equal Weight index.
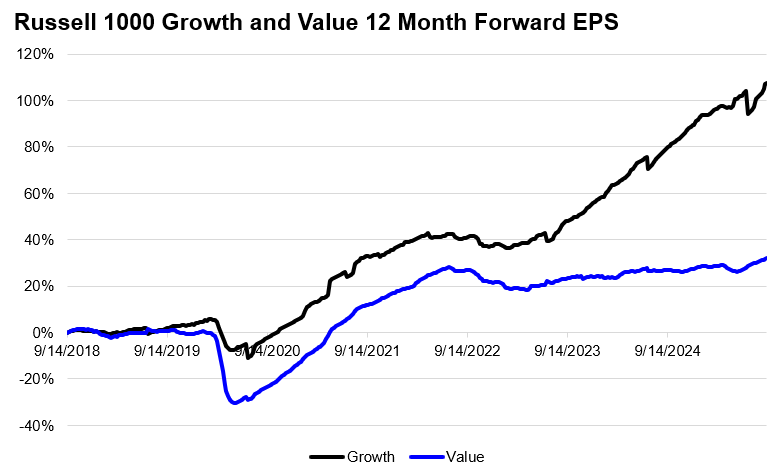
Another way to see this is by comparing the earnings growth of the Russell 1000 Growth index, which is 55% Magnificent 7 stocks, with that of the Russell 1000 Value. Where the Russell 1000 Growth has grown earnings by 45% since its 2021 peak, the Value index has grown earnings just 4%. One thing to note: there are now 3 Magnificent 7 names included in the Value index as of its latest rebalancing (META, AMZN, and GOOG/GOOGL)!
The key question is whether this level of growth can be extrapolated as a driver of broader index earnings, since any slowdown in the ‘Magnificent 7’ would disproportionately impact overall index returns given their 34% weight in the S&P 500.
And this is where the “hope springs eternal” refrain of a “broadening out” looks to be repeated in 2026 estimates. The table below shows how analysts are expecting a fairly meaningful deceleration in Magnificent 7 earnings growth in 2026, which is offset by an acceleration in the Equal Weight/ “everything else” part of the market. Hope for this broadening out of earnings has been consistently dashed over the past few years, as Magnificent 7 has repeatedly surprised to the upside, while everything else has experienced estimate revision cuts.
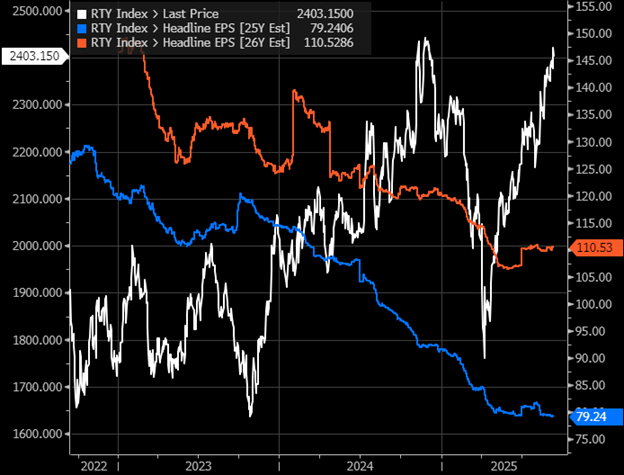
Though not reflected in the large-cap indices, this example of dashed hopes for earnings recovery is seen best by the Russell 2000 index, which has persistently seen its estimates for a powerful recovery in EPS growth get dashed by current economic realities (including high interest rates). The chart below shows how Russell 2000 EPS estimates for 2025 have been cut by 30% over the past year and a half, as hopes for a big rebound in earnings are recalibrated to expectations for merely a flat year.
“Could You Make It On Your Own?”: Conclusion
Earnings are a key reason for the strength of equity markets in recent months. The 12-month forward estimate for the S&P 500 pressing to new all-time highs has paved the way for index to trade to new high levels as well and allowed for the risk-on sentiment that tolerates valuations at prior peaks. If we were to see these forward earnings estimates begin to level off or even turn lower, such as reflecting a slowing in US economic growth, then we would expect US equity market returns to level off or turn lower as well. For now, estimates continue to climb higher, supporting the climb in equity indices.
Just as US equity market returns have been ultra-concentrated in Magnificent 7 companies, the earnings growth for the index has been derived substantially from these same hyper-dominant companies. A huge question for 2026 and beyond is whether or not this supernormal growth in Mag 7 earnings can continue and whether or not we will finally see a broader participation in earnings growth from the remainder of the index. Both remain key topics that will continue to be monitored and debated.
IMPORTANT DISCLOSURES
The views and opinions included in these materials belong to their author and do not necessarily reflect the views and opinions of NewEdge Capital Group, LLC.
This information is general in nature and has been prepared solely for informational and educational purposes and does not constitute an offer or a recommendation to buy or sell any particular security or to adopt any specific investment strategy.
NewEdge and its affiliates do not render advice on legal, tax and/or tax accounting matters. You should consult your personal tax and/or legal advisor to learn about any potential tax or other implications that may result from acting on a particular recommendation.
The trademarks and service marks contained herein are the property of their respective owners. Unless otherwise specifically indicated, all information with respect to any third party not affiliated with NewEdge has been provided by, and is the sole responsibility of, such third party and has not been independently verified by NewEdge, its affiliates or any other independent third party. No representation is given with respect to its accuracy or completeness, and such information and opinions may change without notice.
Investing involves risk, including possible loss of principal. Past performance is no guarantee of future results.
Any forward-looking statements or forecasts are based on assumptions and actual results are expected to vary from any such statements or forecasts. No assurance can be given that investment objectives or target returns will be achieved. Future returns may be higher or lower than the estimates presented herein.
An investment cannot be made directly in an index. Indices are unmanaged and have no fees or expenses. You can obtain information about many indices online at a variety of sources including: https://www.sec.gov/answers/indices.htm.
All data is subject to change without notice.
© 2025 NewEdge Capital Group, LLC
The post Wherever You Will Go appeared first on NewEdge Wealth.


