

How could it all fall in one day?
Were we too sure of the sun?
“If You Need To, Keep Time on Me”, Fleet Foxes
After a period of extraordinary breakout success, Fleet Foxes’ frontman Robin Pecknold was exhausted. Despite fans clamoring for more from the Seattle-based indie folk group, Pecknold put the band on hiatus for three years, during which he attended Columbia University to study literature.
While revising in uptown Manhattan, Pecknold became fascinated by F. Scott Fitzgerald and specifically the essay “The Crack-Up”, which was written during the author’s nervous breakdown. Inspired, Pecknold eventually reassembled Fleet Foxes and named their third album Crack-Up, incorporating similar themes about the weight of success, the haunting of failure, and the emotional exhaustion that comes with both.
Both Crack-Up’s feel especially relevant and reflective to investors after this bruising month of trading that reached a fever pitch on Thursday this week. As markets were melting down through the day, we could have heard investors murmuring the Fleet Foxes Crack-Up lyric, “How could it all fall in one day?” or the Fitzgerald Crack-Up opener, “Of course, all life is a process of breaking down…”
But unlike the tragic end to Fitzgerald’s essay and life (he died four years after the essay was published at just 44 years old), Pecknold’s lyrics contain an ounce of optimism.
The Crack-Up song “If You Need To, Keep Time on Me” is about offering someone grounding and stability amidst rapid change and uncertainty (“keeping time” in music or dance is finding a steady tempo, like a metronome, so it is a beautiful offering to someone to say, “you can look to me for steadiness”).
So, for today’s Weekly Edge we will look to “keep time,” or find stability through this period of heightened uncertainty by looking at both fundamentals and technicals in markets, offering concise conclusions at the end of each segment.
Before we get into the charts, there is one line from Fitzgerald’s “The Crack-Up” that is particularly provocative when considering today’s environment:
“The test of a first-rate intelligence is the ability to hold two opposed ideas in the mind at the same time, and still retain the ability to function.”
We are going to be presenting many Fitzgeraldian “opposed ideas” in the following charts, as contradictions abound in today’s markets, so we will do our best to “still retain the ability to function.”
“If They All Turn, Will You Run?”: Broad Market Observations
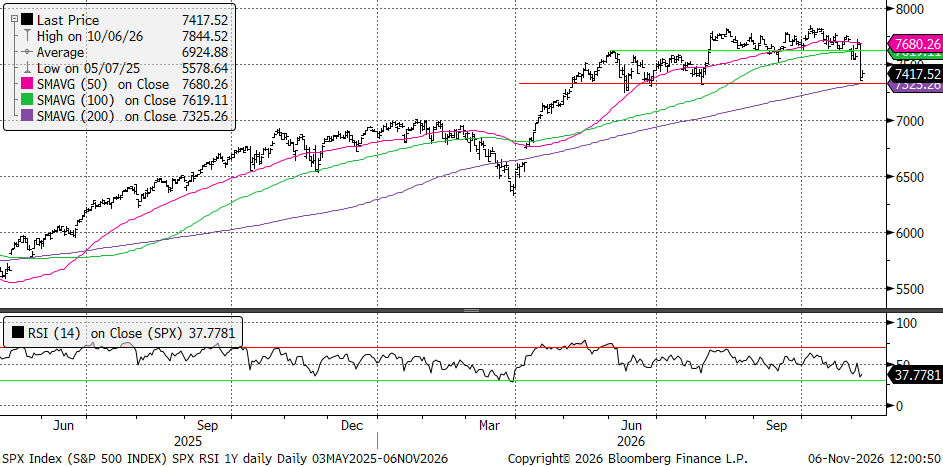
The first observation is that the S&P 500 got close to being externally oversold on Thursday (using a 14 day RSI) and it pulled right back to important support at its 200 day moving average, which is also support from June and July of this year.
S&P 500 with 14 Day RSI
Source: Bloomberg, NewEdge Wealth, as of 11/6/26
These support levels and near oversold condition are likely enough for a near term bounce, potentially up to the 100 day moving average or June high, as shown in the green line above around 7,600.
To go beyond that level, investors could look to catalysts like end of year seasonality tailwinds, light positioning being forced to chase back into the market, and room for valuations to expand/sentiment to improve.
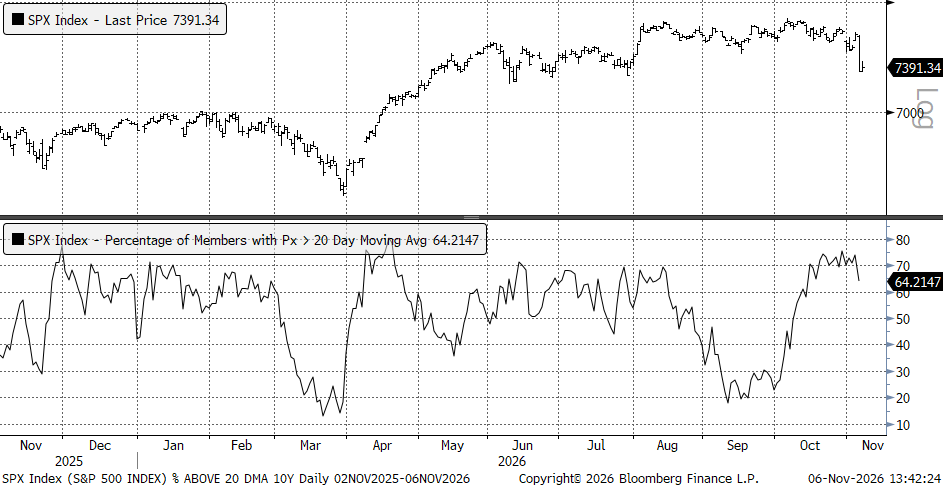
Interestingly, and for our first Fitzgeraldian “opposed idea”, even though the market is near oversold externally (looking at the RSI) the market is nowhere near oversold internally (looking at breadth measures). Below, you can see little evidence of broad, indiscriminate selling, which would typically signal a “flush” condition for markets, by looking at the percentage of names trading above their 20 day moving average still at 64%.
S&P 500 and % of Names Above 20-Day Moving Average
Source: Bloomberg, NewEdge Wealth, as of 11/6/26
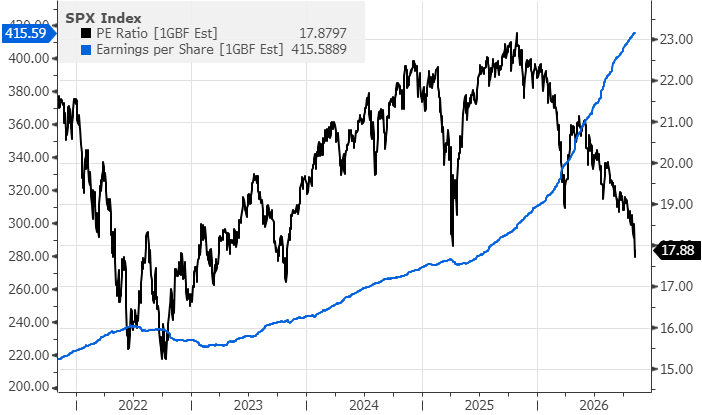
On the valuation note, we have seen a sharp “de-rating” of the market in the past year, with the S&P 500 now trading at 17.9x, below the lows seen during the 2025 liberation day melt-down.
S&P 500 12 Month Forward PE Ratio and EPS
Source: Bloomberg, NewEdge Wealth, as of 11/6/26
Today’s S&P 500 is only down -5% from its all-time high at this valuation vs. the liberation day drawdown at -19.5%. For another Fitzgeraldian “opposed idea”, the source of this valuation compression has been strong earnings, as earnings have grown faster than prices have risen, leading to a lower valuation.
We have been arguing that there are three key reasons for lower valuations over the last year:
- Higher yields are reflecting greater competition/demand for capital as equity supply/issuance expands as well
- Significantly slowing earnings growth into 2027 to ~14% vs. ~36% in 2026 justifies a lower forward multiple
- A deterioration in the quality of earnings at the Magnificent 7 deserves a lower multiple as they transmute themselves from capital light near-monopolies to capital-intensive competitive businesses
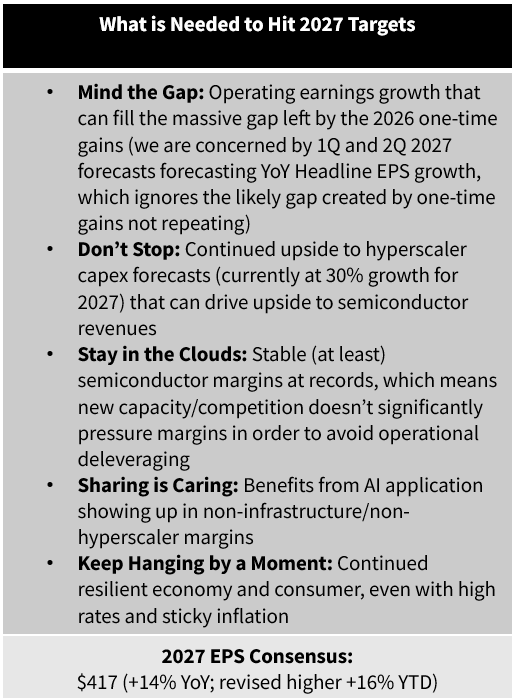
Of course, with valuations already reset back to levels we haven’t seen since 2023, we must turn our eye to the ability for earnings to continue to deliver on now-high expectations. At the beginning of October, we detailed what needs to happen for earnings to meet current 2027 estimates. You can read it here and revisit the table below:
Source: NewEdge Wealth, Bloomberg, as of 10-2-26
The conclusion of this broad market section is this: markets are slightly externally oversold and at support, supporting a near-term bounce, with valuations, positioning, and sentiment now materially reset lower. Earnings, which have been the key source of upside in recent years, face a higher bar in 2027, which requires the AI infrastructure boom to continue to be robust. It is this last point we will dive into next.
“Were We Too Sure of the Sun?”: AI Infrastructure Boom or Bust
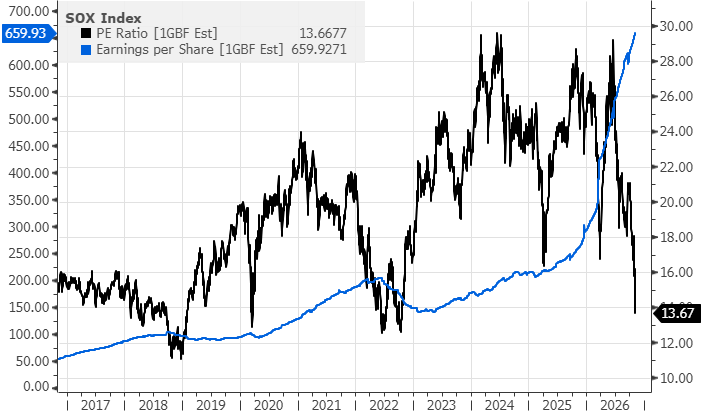
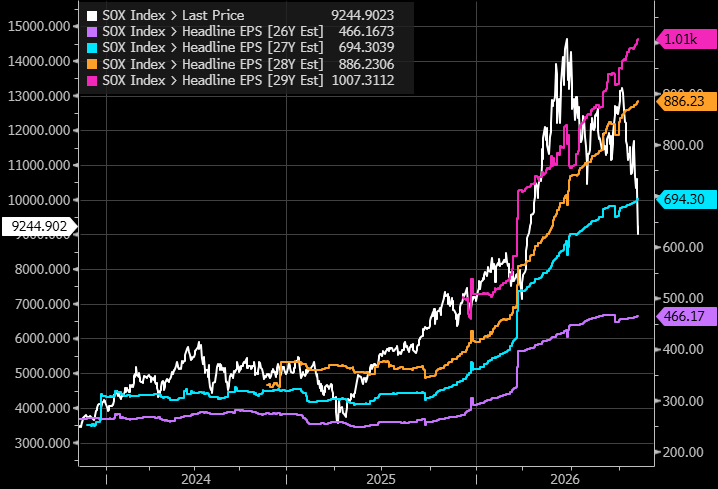
Our next Fitzgeraldian “opposed idea” is this dichotomy: currently, semiconductor valuations are pricing in earnings for the semiconductor industry group to be near a peak in 2027, while at the same time, sell-side forecasters are projecting semiconductor earnings continuing to grow through 2029, doubling over the next three years.
First on valuations, recall that semiconductors trade with “counter cyclical” multiples, so the highest multiple is put on the lowest earnings (in the expectation of a recovery) and the lowest multiple is put on the highest earnings (in the expectation of a decline).
Today’s 13.7x PE multiple for the SOX is near the valuation lows seen in 2018 and 2022 that coincided with the peak in forward earnings estimates those years. This means that today’s semiconductor valuation is pricing in a scenario where 2027 earnings peak and 2028 earnings fall.
Semiconductor Index (SOX) 12 Month Forward PE and EPS
Source: Bloomberg, NewEdge Wealth, as of 11/6/26
But if a 2027 earnings peak is what markets are pricing in, sell-side forecasters (who are notoriously slow to update their projections) certainly have not gotten the memo. The chart below shows the expectation for persistent earnings growth through 2029. If the markets believed these projections (or saw them as a high probability), it is unlikely that the semiconductor group would be trading at today’s low multiples.
Semiconductor Index (SOX) 2026-2029 EPS Forecasts (Bloomberg Consensus)
Source: Bloomberg, NewEdge Wealth, as of 11/6/26
In our 4Q26 outlook, we wrote about the important market maxim that “price leads data”, flagging that the prices will almost always react (and sometimes overreact) before the data begins to change.
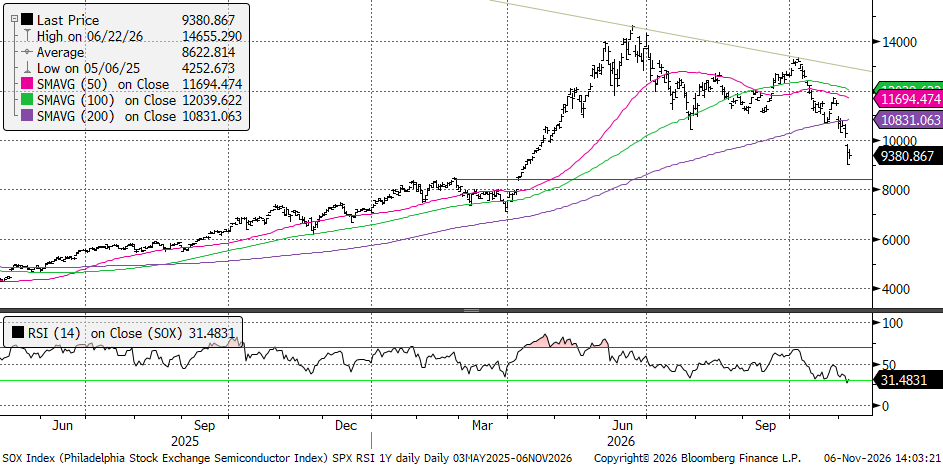
The price action of the last four months of trading since the June peak suggests that 2027-2029 semiconductor (SOX) EPS estimates are at risk of being trimmed (whether it is due to less hyperscaler and neocloud capex growth due to cost of capital and regulatory pressures, or margins falling at memory companies as supply and demand become more balanced).
But there is also a likelihood that prices have overreacted in the near term, suggesting potential for a short-term rebound in oversold semiconductor shares.
Semiconductor Index (SOX) and RSI
Source: Bloomberg, NewEdge Wealth, as of 11/6/26
For more Fitzgeraldian “opposed ideas”, we see all of these statements as able to be true at the same time:
- SOX could have already peaked back in June for this cycle
- SOX could rebound nearly 40% just to get back to a downtrend line
- SOX earnings could fall in 2028 on margin normalization alone even if the AI infrastructure buildout continues to grow
When we have shared these views in recent weeks/months, we have received resounding incredulity in response, but past technology booms have taught us the important lesson that we can be early in the adoption curve of a new technology and not be early in the return curve for the infrastructure being built to deliver that technology.
Another important lesson is that the beneficiaries of the infrastructure buildout of a technology are almost always different than the ultimate beneficiaries of the application of the technology (as seen with railroads, automobiles, main frame computers, the Internet, and likely now AI).
The conclusion of this segment is: the AI infrastructure/semiconductor sell-off looks to be overdone in the near term, setting up for a short term bounce, but the potential for out-year EPS estimate cuts suggests that post a technical rebound, volatility could ensue.
“A Frightened Fool Stokes”: Unsafe Safety Trades
Our last Fitzgeraldian “opposed idea” is that many safety areas of the market have become less safe because of high valuations, which have soared as the market has sharply rotated out of technology and into this defensives areas.
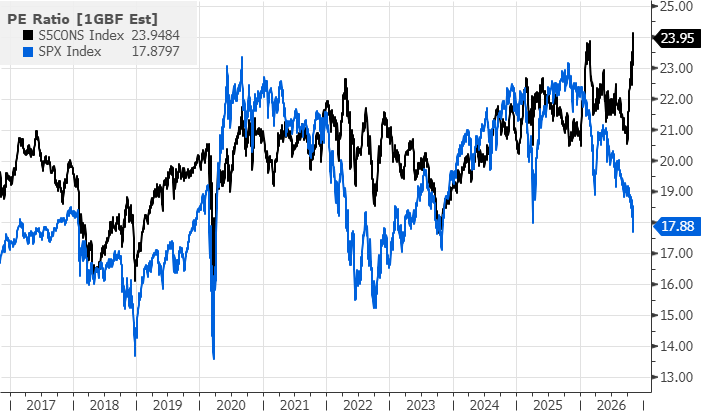
Consumer Staples is particularly notable, with the group now trading at a 34% premium to the S&P 500, a record for the last 10 years and much higher than the average premium of 6% over that period. The chart below shows the divergent paths of the Staples and S&P 500 PE ratios.
Consumer Staples and S&P 500 Forward PE Ratios
Source: Bloomberg, NewEdge Wealth, as of 11/6/26
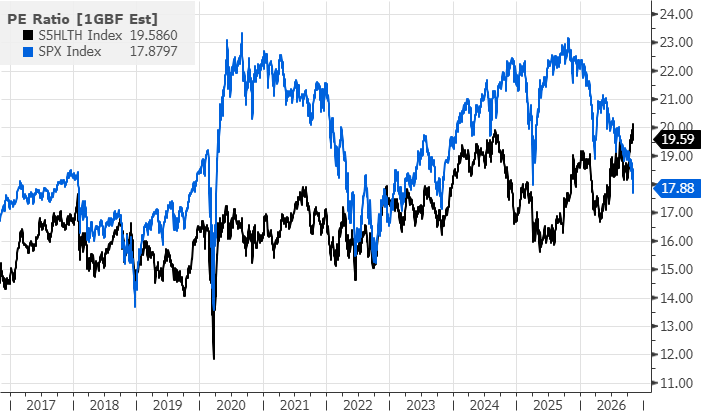
Looking at Healthcare, the sector has now flipped to a premium to the S&P 500 for the first time in the last decade, as show below.
Healthcare and S&P 500 Forward PE Ratios
Source: Bloomberg, NewEdge Wealth, as of 11/6/26
The conclusion of this segment is that safety trades have now become so expensive that they carry higher risk, with valuations having room to fall if, paradoxically, the market swings back to a risk-on/pro-cyclical tone OR market weakness becomes broader based.
Who Knows What State is In Store: Conclusion
Uncertainty is a feature, not a bug of markets. But after months like the last, where leadership rotations have been violent, volatility has spiked, and prior market narratives have been challenged, it can be easy to get lost in the uncertainty.
We try to be like the Fleet Foxes Crack-Up and “keep time” in times like this by stripping the emotion away and looking at technicals and fundamentals, but as we flagged throughout this piece, there are many Fitzgeraldian Crack-Up “opposed ideas” even within these measures.
Thankfully, key measures like valuation, sentiment, and positioning have meaningfully reset enough to support a near term bounce for equities, but we will remain vigilant as we near 2027, looking for signs that the AI-driven earnings tailwind, which has been so vital to this bull market, can continue to blow.
IMPORTANT DISCLOSURES
The views and opinions included in these materials belong to their author and do not necessarily reflect the views and opinions of NewEdge Capital Group, LLC.
This information is general in nature and has been prepared solely for informational and educational purposes and does not constitute an offer or a recommendation to buy or sell any particular security or to adopt any specific investment strategy.
NewEdge and its affiliates do not render advice on legal, tax and/or tax accounting matters. You should consult your personal tax and/or legal advisor to learn about any potential tax or other implications that may result from acting on a particular recommendation.
The trademarks and service marks contained herein are the property of their respective owners. Unless otherwise specifically indicated, all information with respect to any third party not affiliated with NewEdge has been provided by, and is the sole responsibility of, such third party and has not been independently verified by NewEdge, its affiliates or any other independent third party. No representation is given with respect to its accuracy or completeness, and such information and opinions may change without notice.
Investing involves risk, including possible loss of principal. Past performance is no guarantee of future results.
Any forward-looking statements or forecasts are based on assumptions and actual results are expected to vary from any such statements or forecasts. No assurance can be given that investment objectives or target returns will be achieved. Future returns may be higher or lower than the estimates presented herein.
An investment cannot be made directly in an index. Indices are unmanaged and have no fees or expenses. You can obtain information about many indices online at a variety of sources including: https://www.sec.gov/answers/indices.htm.
All data is subject to change without notice.
© 2026 NewEdge Capital Group, LLC


