Float, float on
Float on, float on
Float, float, float on
The Floaters, 1977
An economy that grows robustly inevitably slows down. In today’s US economy, there are signs of continued strength, such as strong headline jobs data, but also a few signs of weaknesses, such as in consumer credit delinquencies and commercial real estate that have not caused a downturn. In our recent Investment Outlook, we called this a “strange landing” because the economic data shows strengths and weaknesses at the same time.
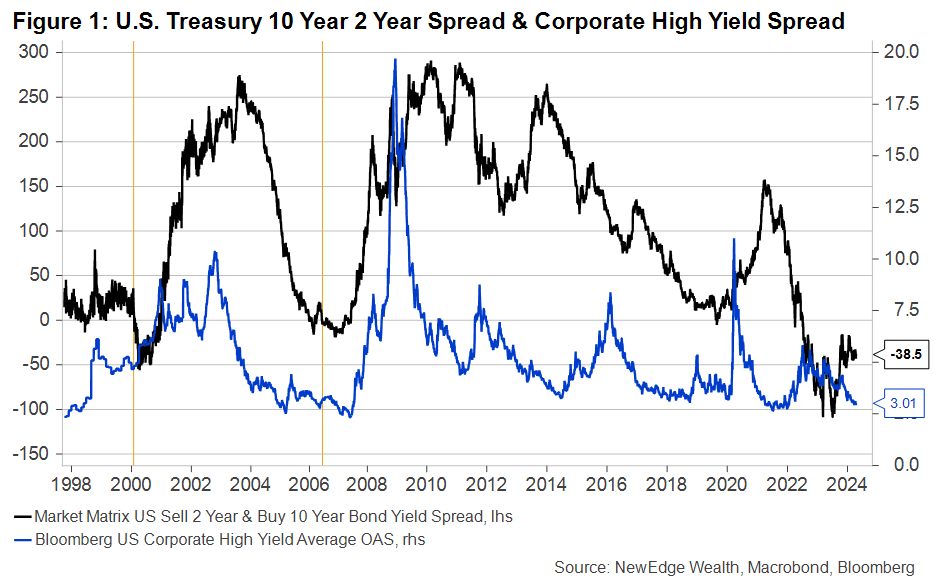
In 2021-2023, the Federal Reserve had to take extraordinary steps to manage the economy through the pandemic. Interest rates were slashed to zero and the Fed expanded the balance sheet by about 5 trillion dollars according to Federal Reserve data. The economy recovered quicker than foreseen and inflation surged. The Fed had to raise rates at the fastest pace since the 1980s. These significant policy actions led to distortions in the bond market such as an inversion of the yield curve with short-term rates remaining above long-term rates for the past 22 months. Yield curve inversions are often seen as a sign of a recession, and yet, the US economy has displayed resilient and even robust growth despite the lengthy inverted period.
The history of yield curve inversions is that once the business cycle begins to show signs of a turn for the worse, the market will price in rate cuts, which causes short term rates to fall. The yield curve then “normalizes”, with short-term rates falling below long-term rates. In the current environment, the yield curve has been unable to normalize because the strength of the economy has kept inflation stickier, prompting the Fed to leave interest rates at 5.25 to 5.5 percent.
Despite higher rates, credit markets have been strongly performing. Since early 2023, credit spreads have narrowed by 150 basis points according to Bloomberg data. Previously, before a recession started, such as in 1999-2000 and 2006-2007, the yield curve briefly inverted, which was followed by a widening of credit spreads as shown In Figure 1.
As of 4/12/24
Presently, credit spreads have done the opposite, falling during the period of this yield curve inversion. The expectations of rate cuts may have contributed to the recent tightening of spreads, while there are also supply and demand factors likely at play (investors wanting to lock in higher all-in yields, while bond issuance has been sparse until recent months).
The markets are pricing 1.9 number of rate cuts by year-end, but the expectations of a recession are moderate as seen from tight credit spreads, while rising Treasury yields and stock prices reflect expectations of strong growth. The Fed has acknowledged that the economy is strong and several Fed officials like Williams, Collins, Bostic and Barkin have said there is no rush to lower rates. The Fed can likely leave rates higher for longer, for the time being, to control inflation and sustain the economic expansion. The policy strategy is unique for this period, but it means that while data is strong, floating rate debt continues to be relevant for investors, while high grade credit is attractive, mostly in the event of data softening that could cause spread widening.
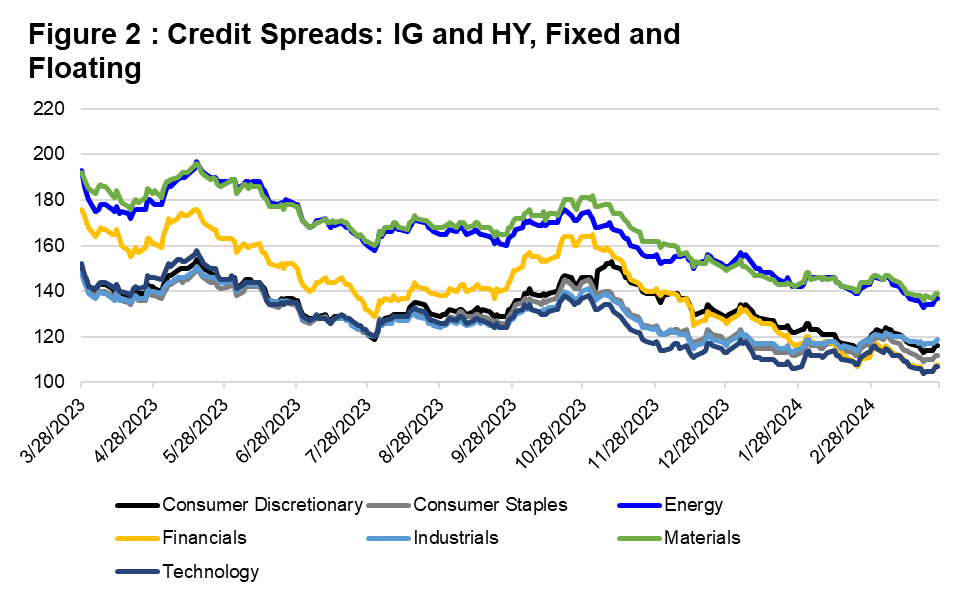
Broadening and Floating
There has been a lot of discussion about the “broadening” of the rally in stock markets, which is also happening in credit markets. The spreads across sectors have narrowed at a similar pace and reached new lows since early 2023 (Figure 2).
Source: Bloomberg Intelligence, NewEdge Wealth, as of 4/12/24
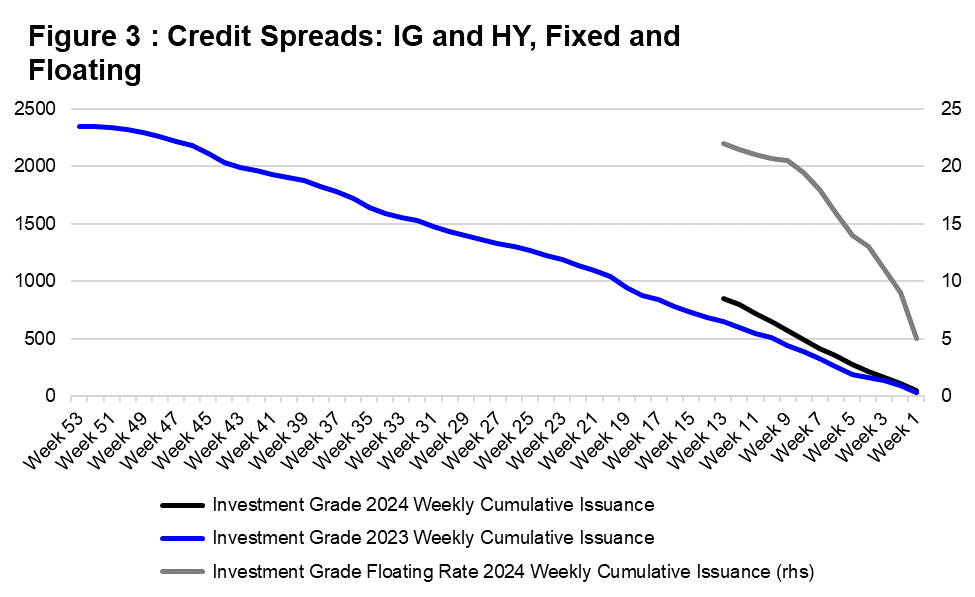
Against this backdrop, there has been a brisk pace in corporate bond issuance. Year to date, more than $250 billion has been issued and the cumulative weekly supply of Investment Grade bonds is tracking one and a half times higher than in 2023 (Figure 3). If the pace of issuance continues through the end of the year, more than $2.5 trillion in bonds will be issued as estimated by Bloomberg Intelligence Research.
In floating rate bonds, issuance has been robust as well, but in absolute terms less than 10 percent of the year-to-date total.
Source: Bloomberg Intelligence, NewEdge Wealth, as of 4/12/24
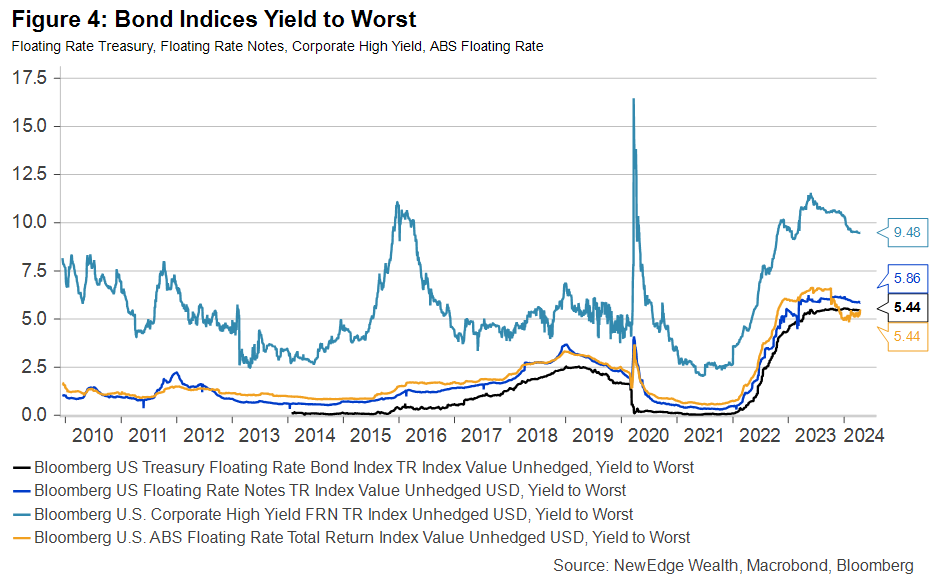
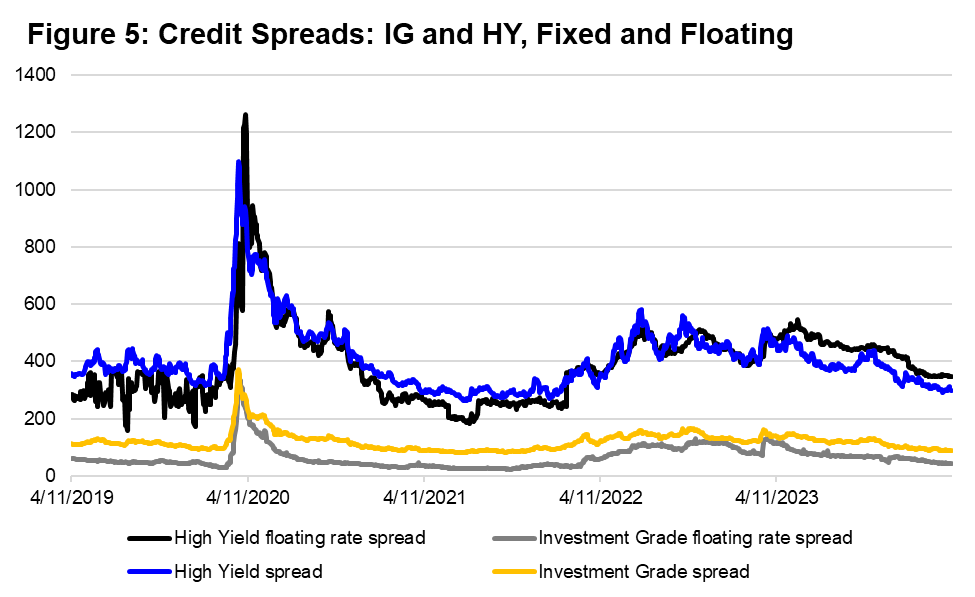
The floating universe consists of investment grade, high-yield, asset-backed securities, and US Treasuries. The investment grade floating rate indices have a yield to worst are around 5.25% to 5.85%. The High Yield floating rate index yields 9.5% (Figure 4). The spreads on floating rate bonds have narrowed since 2020, in line with the tightening of spreads on fixed-rate coupon bonds (Figure 5).
A floating-rate security has the advantage of low-interest rate risk. The duration of floating-rate indices is on average 1-year according to Bloomberg indices. The investment is not without risk. If interest rates decline, the return of the security could fall due to reinvestment risk. But in an environment where the Fed keeps rates on hold, investors can generate a high coupon return from a floating-rate security that has limited interest rate risk if interest rates were to rise further.
Investors’ portfolios can benefit from the stable performance of floating-rate and short-maturity bonds that offer a balance against longer maturity securities that can experience volatility from surprisingly strong economic data. However, investors must also be aware that if data were to weaken and interest rates were to fall, floating rate securities would see their yields fall and miss out on price appreciation that fixed rate securities present in a falling rate environment.
As of 4/12/24
Source: Bloomberg, NewEdge Wealth, as of 4/12/24
Credit Watch
Risks of a correction in credit, however, are rising. The recent strong performance of credit has been driven by spread tightening, which is positively correlated with stock prices. With substantially larger issuance on the horizon, any potential correction in equities could reverse the demand for credit.
Risk premiums in High Yield for the most speculative ratings such as CCC and single B are getting into territory that has been historically a precursor to a significant widening of spreads. The current default rates for investment grade and High Yield are low, estimated by Moody’s at 0.5% to 1.5%, however the projection by Moody’s is for default rates to rise to 3.5% to 4%.
The expected rise in default rates is currently not reflected in corporate bond spreads. If the economy were to weaken and corporate profits to decline, credit spreads can widen as rising default risk is priced in. The widening in spreads can exacerbated by the estimated $3 trillion of refinancing of corporate bonds by 2025.
Conclusion
As the Federal Reserve looks to start the next easing cycle with caution and likely a few, slow incremental rate cuts, we expect the yield curve to normalize over the cyclical horizon moderately. We believe investors can therefore continue to reap high returns in shorter maturity fixed income, including in credit and floating rate bonds. In that environment, we favor high-quality corporate, and structured credit floating-rate securities that offer a relatively stable return. We remain attune to future economic risks that could spark a drop in yields that could disadvantage floating rate debt and hurt lower grade credit.
IMPORTANT DISCLOSURES
Abbreviations/Definitions: Barkin: Thomas Barkin, President of the Federal Reserve Bank of Richmond; Bostic: Raphael Bostic, President of the Federal Reserve Bank of Atlanta; Collins: Susan Collins, President of the Federal Reserve Bank of Boston; Williams: John Williams, President of the Federal Reserve Bank of New York.
Index Information: All returns represent total return for stated period. S&P 500 is a total return index that reflects both changes in the prices of stocks in the S&P 500 Index as well as the reinvestment of the dividend income from its underlying stocks. Dow Jones Industrial Average (DJ Industrial Average) is a price-weighted average of 30 actively traded blue-chip stocks trading New York Stock Exchange and Nasdaq. The NASDAQ Composite Index measures all NASDAQ domestic and international based common type stocks listed on the Nasdaq Stock Market. Russell 2000 is an index that measures the performance of the small-cap segment of the U.S. equity universe. MSCI International Developed measures equity market performance of large, developed markets not including the U.S. MSCI Emerging Markets (MSCI Emerging Mkts) measures equity market performance of emerging markets. Russell 1000 Growth Index measures the performance of the large- cap growth segment of the US equity universe. It includes those Russell 1000 companies with relatively higher price-to-book ratios, higher I/B/E/S forecast medium term (2 year) growth and higher sales per share historical growth (5 years). The Russell 1000 Value Index measures the performance of the large cap value segment of the US equity universe. It includes those Russell 1000 companies with relatively lower price-to-book ratios, lower I/B/E/S forecast medium term (2 year) growth and lower sales per share historical growth (5 years). The BBB IG Spread is the Bloomberg Baa Corporate Index that measures the spread of BBB/Baa U.S. corporate bond yields over Treasuries. The HY OAS is the High Yield Option Adjusted Spread index measuring the spread of high yield bonds over Treasuries.
Sector Returns: Sectors are based on the GICS methodology. Returns are cumulative total return for stated period, including reinvestment of dividends.
The views and opinions included in these materials belong to their author and do not necessarily reflect the views and opinions of NewEdge Capital Group, LLC.
This information is general in nature and has been prepared solely for informational and educational purposes and does not constitute an offer or a recommendation to buy or sell any particular security or to adopt any specific investment strategy.
NewEdge and its affiliates do not render advice on legal, tax and/or tax accounting matters. You should consult your personal tax and/or legal advisor to learn about any potential tax or other implications that may result from acting on a particular recommendation.
The trademarks and service marks contained herein are the property of their respective owners. Unless otherwise specifically indicated, all information with respect to any third party not affiliated with NewEdge has been provided by, and is the sole responsibility of, such third party and has not been independently verified by NewEdge, its affiliates or any other independent third party. No representation is given with respect to its accuracy or completeness, and such information and opinions may change without notice.
Investing involves risk, including possible loss of principal. Past performance is no guarantee of future results.
Any forward-looking statements or forecasts are based on assumptions and actual results are expected to vary from any such statements or forecasts. No assurance can be given that investment objectives or target returns will be achieved. Future returns may be higher or lower than the estimates presented herein.
An investment cannot be made directly in an index. Indices are unmanaged and have no fees or expenses. You can obtain information about many indices online at a variety of sources including: https://www.sec.gov/fast-answers/answersindiceshtm.html.
All data is subject to change without notice.
© 2024 NewEdge Capital Group, LLC
The post Float On: Floating Rate and Credit Conditions in a Higher for Longer Backdrop appeared first on NewEdge Wealth.


