One iconic evening in 2003, Pearl Jam fired up the crowd at Madison Square Garden so much that the stage started shaking, bouncing up and down as they ripped “Do the Evolution.”
This past week, Pearl Jam returned to the Garden, celebrating their 50th New York show. Though they sounded fantastic, the stage didn’t quite shake like it did twenty years ago, reflecting how even the most fervorous fans settle in, or evolve, with time (and certainly Eddie Vedder, or as the surf community calls him, “Shreddie Vedder,” was not climbing any scaffolding like he did during the even-more-iconic 1992 Pearl Jam show at Jones Beach).
In many ways, recent macro and market data resembles Pearl Jam’s cooling of energy, whether we are looking at labor data or equity market leadership and returns. Of course, the biggest question facing investors is if this slowing and cooling of data “does the evolution” into outright weakness for the economy and markets.
This week’s Weekly Edge will be split into two main sections, one looking at the evolution of labor market data and the other looking at the evolution of equity market leadership.
“I’m Ahead, I’m a Man”: The Cooling of the Labor Market
The Labor Market Is Slowing but Not Collapsing
The past few years have seen the U.S. labor market evolve from a red-hot, stage-shaking, scaffolding-climbing state in 2021 to a more subdued, home-by-midnight but still historically healthy state in 2024.
In this week’s data for August, payroll growth fell short of expectations (142k vs. 160k consensus) and was revised lower for prior months. The data still suggests that the labor market is primarily experiencing a normalization, or cooling, from the ultra-tight levels post-pandemic, not outright weakness.
The best evidence for this “slowing, not collapsing” as the current state is simply the absolute number of people employed in the U.S. economy. This measure of Nonfarm Payrolls, as shown below, remains at all-time highs, which is driving the resilience of consumer incomes, consumer spending, and overall economic growth.
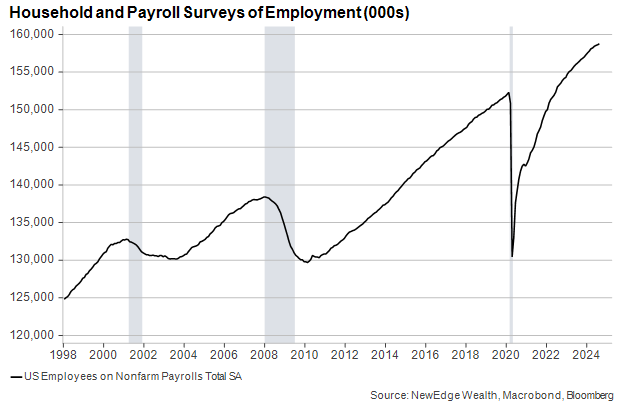
It is vitally important to note that this measure of total employment tends to decline materially once a recession is underway, meaning it helps us describe the current state of the labor market, not necessarily where it is going in the future.
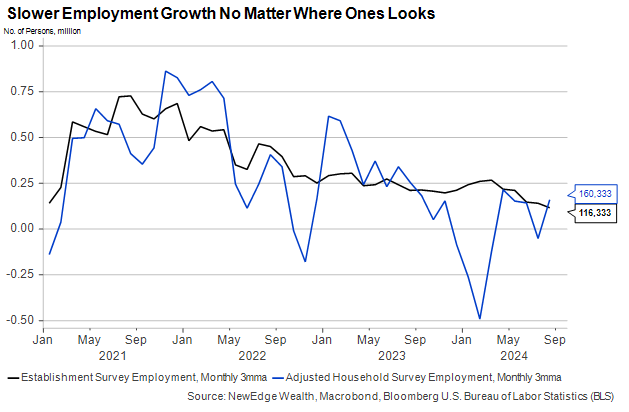
From the perspective of monthly job additions, both labor market surveys – the Nonfarm Payroll survey focused on employers and the Household Survey one focused on households– tell a similar story of a slowing, but not collapsing labor market.
In a similar way, unemployment is still historically low and not rising especially quickly, ticking down in the August report to 4.2% vs. 4.3% prior. This slower climb in the unemployment rate is due to the source of what has been driving the measure higher: slower hiring, not widespread layoffs.
As we have discussed in recent weeks, the ultimate question is whether this slower hiring leads to increased firings. In past cycles, this has certainly been the case, with a slowdown in hiring being eventually followed by increased firings and, thus, a rapid ascent in the unemployment rate. However, given the Strange Landing distortions from the pandemic (including dynamics like “labor hoarding” after the troubles companies had hiring and retaining workers in 2020-2022), it is not a certainty that a rapid surge in firings will soon come.
Weakening Hiring Not Weighing on Consumers…Yet
We care about the monthly jobs data for two reasons. First, it informs Fed policy (more on that below), and second, consumer confidence in the labor market is a key ingredient into household spending.
When consumers feel less secure in their jobs – even if they have not been laid off and aren’t looking for a new one – they tend to save more of what they earn, thereby reducing household consumption and eventually cutting into corporate profits, which then increases the risk of actual layoffs. The end of economic cycles can become self-fulfilling prophesies in that way.
This shouldn’t be a major source of concern yet. As shown in the first chart above and the employment to population ratio below, prime-age workers are employed at just about their highest rates ever, even as overall labor force participation is dragged down by the aging population.
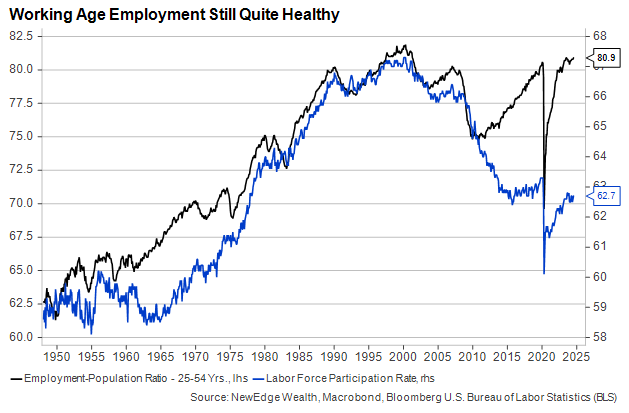
This graph contains two bits of good news. First, working age consumers are likely to continue spending. Second, a large and growing percentage of the population (i.e., retirees) is relatively insensitive to labor market concerns as it decides how much to spend. Stock market behavior, on the other hand, is a much more important factor in determining how consumers over 55 behave, meaning significant downside in equity markets could have a meaningful impact on consumer spending.
So, What’s the Fed Going To Do?
It’s easy to imagine FOMC members were quietly rooting for a definitive take on the labor market from the data in Friday’s report, but they didn’t get one. Even with the weaker headline data, markets reduced the probability of a 50 bps cut in September from ~40% to ~30% in response to the inconclusive data.
Next week brings August inflation data, but, in truth, the labor market has become the more important factor in the size and pace of rate cuts with inflation fading. We have been arguing that there is more downside risk to jobs and economic growth than there is upside risk to inflation in the remainder of 2024.
Given the murkiness of the data, here is what we know: the Fed’s target rate is now 5.375%, which is far higher than virtually any economists’ estimate of neutral. By some measures, monetary policy is more restrictive today than it has been at any other time since the Volcker era in the early 1980s.
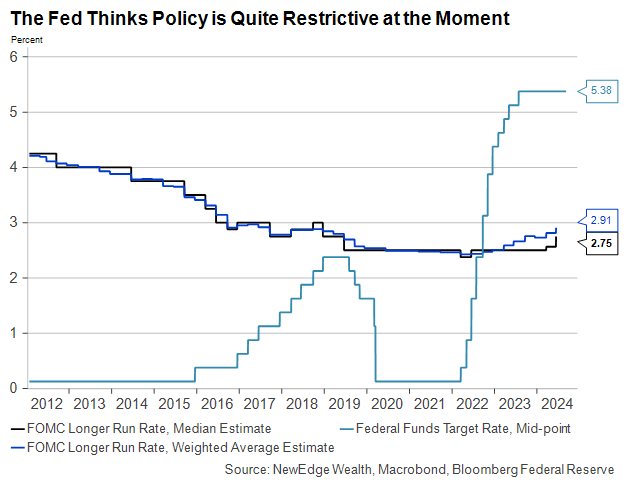
We also know that despite the unemployment rate’s slight tick down in August (from 4.253% to 4.221%, if you can believe it), it’s more likely to rise than fall in the coming months as the trends of slower hiring likely persist. That’s quite normal when the Fed is cutting interest rates.
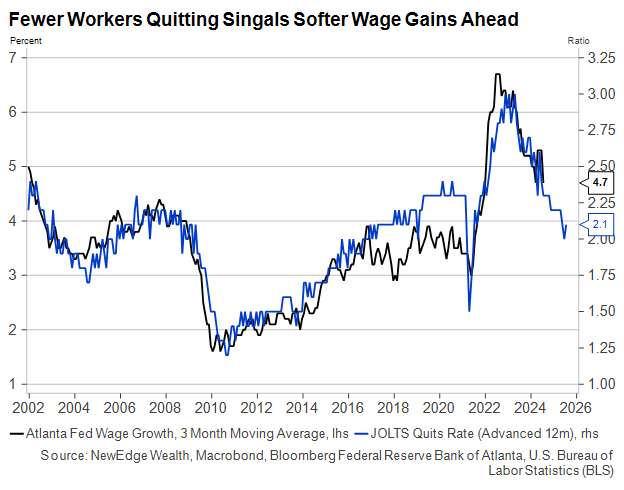
Lastly, we know that given the softening in the labor market this year, wage growth has receded as an inflationary threat. Fewer workers are quitting their jobs as openings and hiring have fallen, and this tends to mean pay increases will be harder to come by.
“I’m at peace, I’m the man; Buying stocks on the day of the crash, yeah”: The Evolving Equity Market
A September to Remember
One week into September and markets already appear to be buckling under the weight of seasonality. As we detailed in our Monday charts this past week, highlighting charts from Jeff Hirsch, seasonality is a notable headwind for markets in September and October, mostly during election years.
As we wrote, seasonality is not destiny, meaning other factors can overwhelm seasonal impacts; however, given the S&P 500 was trading within 1% of all-time highs with stretched valuations, sentiment, and positioning, it is unsurprising to see the market trade weaker as it goes into this tougher seasonal stretch.
Despite Friday’s weak trading, the S&P 500 is not oversold yet (moving too far, too fast to the downside) on an external basis, looking at the Relative Strength Index (RSI), or an internal basis, looking at the percentage of names trading above their 50-day moving average. Both charts are shown below and display how neither of these measures are at levels typically reached at ultimate lows (for example, 67% of S&P 500 names are still above their 50-day moving average, compared to a reading below 20% at the October 2023 lows).
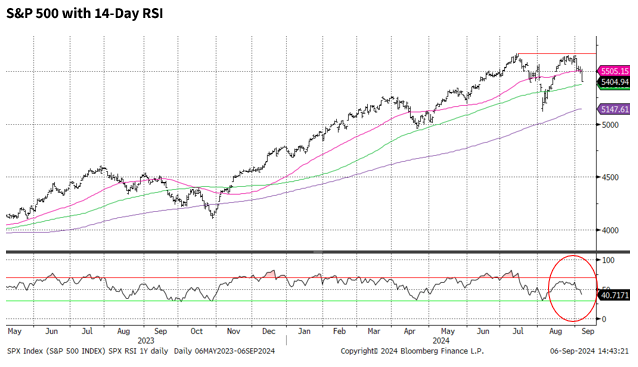
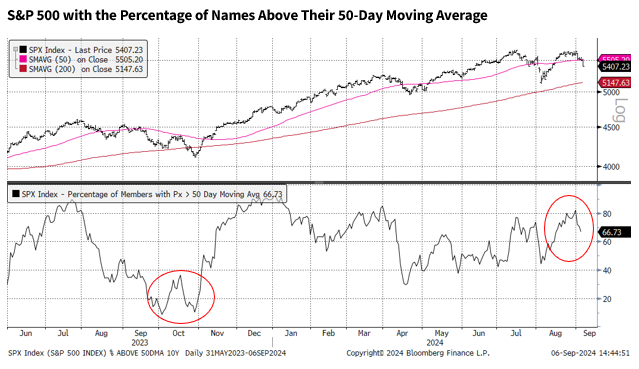
We would not be surprised to see recent volatility continue as the market faces seasonal headwinds and digests the lofty valuations/expectations with which it entered this calendar stretch. As always, we see volatility as opportunity for those that are underinvested, watching important support levels, like the August lows and the 200-day moving average at ~5,150 as potentially attractive entry points.
Leadership Shifts Distinctly
One of the key market evolutions of the last two months has been the distinct shift in leadership away from the ultra-dominance of high-flying Technology and Communication Services, home to most of the Mag 7 stocks, towards defensive sectors like Utilities, Staples, and Health Care. This has been the most notable leadership evolution since the October 2022 low.

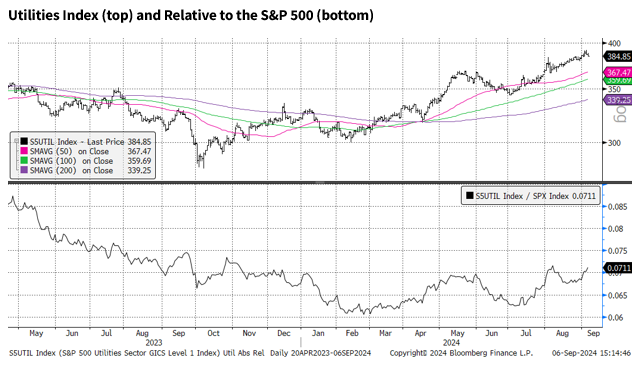
Jeff DeGraff of Renaissance Macro has been doing fantastic work on what leads and lags after the first rate cut. His work has shown that after the first cut, cyclicals, inclusive of Technology tend to lag the market, while defensives tend to outperform.
Interestingly, since the probability of a 25 bps cut in September went over 100% back in July, the market has been trading as if the first cut has already happened. Technology and Communication Services shares have weakened substantially, while Utilities, Staples, and Health Care have been market leaders. As shown below, the relative performance of the defensive Utilities sector vs. the S&P 500 has been trading in lock-step with the pricing of rate cuts in 2024, with more rate cuts associated with better performance for risk-off, defensive sectors.
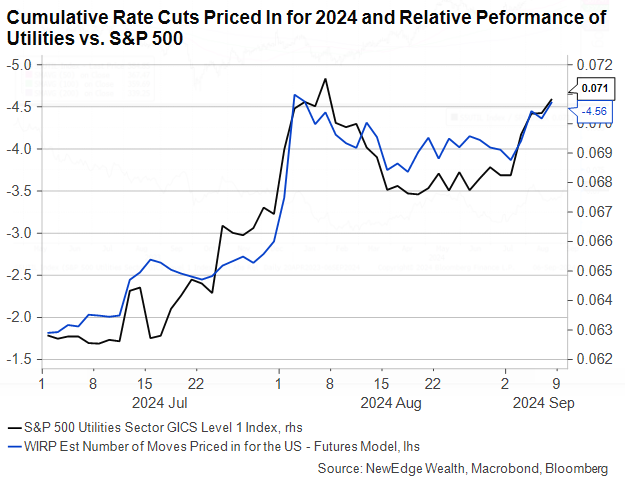
It is important to note that defensive leadership in markets is typically associated with periods of weaker overall market returns given it is a sign that investors are reducing risk and becoming more concerned about the outlook for growth. Defensive leadership, if sustained, often coincides with both PE multiple compression and periods of earnings forecast cuts.
This sector rotation has also translated to a breakdown in the Growth vs. Value ratio, which, as of Friday, traded below its 200-day moving average for the first time since early 2023, suggesting a broader trend change, or evolution, in market leadership away from Tech/Growth/Mag 7 and towards Value/defensive.

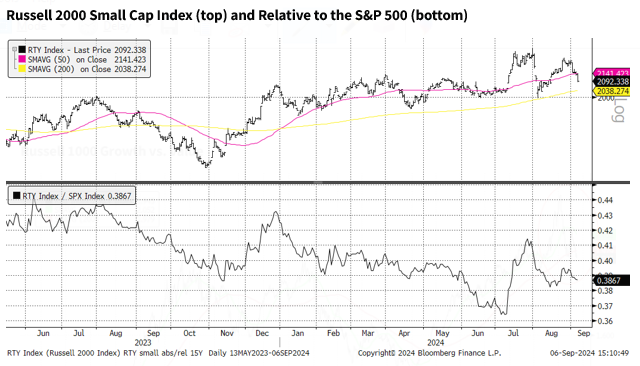
Notably, not all rotations are created equal, with small caps trading weaker and underperforming the market. Small caps, though in theory enjoying lower interest rates, need a resilient growth and risk-on backdrop to see improved performance. Given the rising growth fears and risk-off leadership, it is unsurprising to see small caps lag despite cheap valuations and light positioning.
This shift from risk-on, pro-growth, high-valuation leadership to risk-off, growth-fears, lower-valuation leadership is captured in the breakdown of the High Beta vs. Low Beta ratio, which we also featured and detailed in last Monday’s charts.
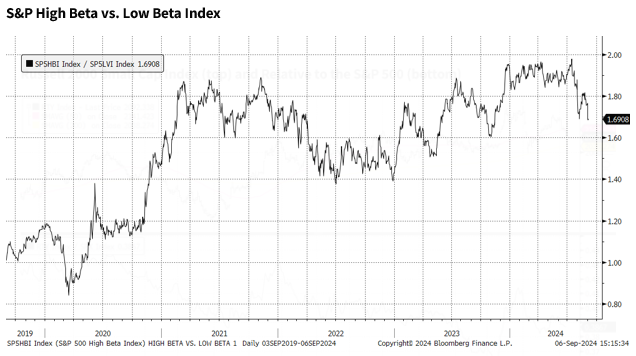
Overall, we see potential for these leadership rotations to continue, at least through this choppy seasonal stretch in September and October, fueled by the start of the rate cutting cycle and amplified by the stretched valuations, positioning, and sentiment seen in Growth/Tech/Mag 7 leadership at the July peak, which are now being unwound.
Conclusion
Pearl Jam may still be “Rockin’ in the Free World,” but, clearly, there has been an evolution in their energy, just like labor market data and equity market leadership. When it comes to jobs, we observe that the labor market has clearly slowed but is not collapsing, however questions remain about the direction of travel and if this slowing continues to evolve into outright weakness. From a markets perspective, there has been a clear evolution to a risk-off, defensive tone for markets, which raises questions about still-lofty valuations and expectations for earnings growth into 2025.
IMPORTANT DISCLOSURES
The views and opinions included in these materials belong to their author and do not necessarily reflect the views and opinions of NewEdge Capital Group, LLC.
This information is general in nature and has been prepared solely for informational and educational purposes and does not constitute an offer or a recommendation to buy or sell any particular security or to adopt any specific investment strategy.
NewEdge and its affiliates do not render advice on legal, tax and/or tax accounting matters. You should consult your personal tax and/or legal advisor to learn about any potential tax or other implications that may result from acting on a particular recommendation.
The trademarks and service marks contained herein are the property of their respective owners. Unless otherwise specifically indicated, all information with respect to any third party not affiliated with NewEdge has been provided by, and is the sole responsibility of, such third party and has not been independently verified by NewEdge, its affiliates or any other independent third party. No representation is given with respect to its accuracy or completeness, and such information and opinions may change without notice.
Investing involves risk, including possible loss of principal. Past performance is no guarantee of future results.
Any forward-looking statements or forecasts are based on assumptions and actual results are expected to vary from any such statements or forecasts. No assurance can be given that investment objectives or target returns will be achieved. Future returns may be higher or lower than the estimates presented herein.
An investment cannot be made directly in an index. Indices are unmanaged and have no fees or expenses. You can obtain information about many indices online at a variety of sources including: https://www.sec.gov/answers/indices.htm.
All data is subject to change without notice.
© 2024 NewEdge Capital Group, LLC


