


It’s funny how it’s the little things in life
That mean the most
Not where you live, what you drive
Or the price tag on your clothes
There’s no dollar sign on a piece of mind
This I’ve come to know
So if you agree, have a drink with me
Raise your glasses for a toast
To a little bit of chicken fried
Cold beer on a Friday night
A pair of jeans that fit just right
And the radio up
“Chicken Fried”, Zac Brown Band
Zac Brown Band’s 2008 tailgate banger “Chicken Fried” is about savoring the simple, little things in life. It is a song about being able to enjoy and celebrate life, without the need for material things (save for cold beer and a great-fitting pair of jeans).
It seems as though Nasdaq traders have taken this concept of celebrating in the absence of material things and gone hog wild with it.
In a stunning display of risk appetite (and with great thanks to our Jay Peters for his incisive analysis), the stocks within the Nasdaq Composite that have either no revenues, or no profits are outperforming the broader market by a degree not seen since the 2020-2021 pandemic boom.
Jay makes the following observations in looking at the YTD performance of the Nasdaq Composite, which itself is up nearly 23% YTD and is made up of about 1,000 underlying companies (T12 in the analysis below stands for trailing 12 month, data via Bloomberg as of 10-31-25):
1. There are 31 companies in the index that generate no revenues, and those 31 are up an average of 67% YTD.
2. If you expand this to companies with negative T12 sales per share, accounting for dilution, there are 277 companies in the index with negative T12 sales per share. And those are up an average of 49% YTD.
3. There are 296 companies with negative T12 Net Income; those companies are up an average of 46% YTD.
4. There are 292 companies with negative T12 EPS; those companies are up an average of 47% YTD.
5. It’s a hodgepodge of companies that have these characteristics, but if you look at companies with negative T12 EPS and sort by what is up the most YTD, you see things like crypto miners, quantum computing stocks, biotechs, solar companies, space exploration/satellite launch companies, and rare earth metals companies.
6. The SPAC INDEX is up 45% YTD, which you could also point to as home to a lot of these types of plays.
Stunning! No revenues, no profits, but huge gains!
We have seen this story before, as mentioned earlier, with the post-pandemic policy-fueled run-up in speculative, unprofitable stocks back in 2020 and 2021. That era of speculation was sparked by huge liquidity support from the Fed (in those years the Fed more than doubled its balance sheet to nearly $9 trillion, while the M2 Money Supply grew 42% in aggregate), direct fiscal support to consumers (“stimmy” checks used for trading), and the advent of app-based, “gameified” trading that brought new investors into markets (a concept called “marketability” that the great Quinn and Turner argue is essential for a bubble to form).
Today, we don’t have the same degree of liquidity flood as we did in 2020-2021, but liquidity is clearly ample enough (boosted by liquidity from China and the Fed’s rate cutting and end to Quantitative Tightening) to support these kinds of liquidity-sensitive stocks.
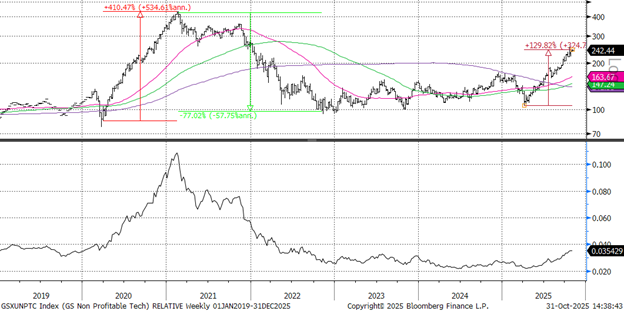
The chart below shows the performance of Goldman Sachs’ Non Profitable Tech Index first and the SPAC Index second, comparing the post-pandemic rally to today’s. Here you can see that today’s Non Profitable Tech rally has paled into comparison to the feverish jump from March 2020-January 2021, whereas the SPAC rally from June 2020 to February 2021 is being bested by today’s 114% rally off of the Liberation Day lows.
Goldman Sachs Non Profitable Tech Absolute (top) and Relative to the S&P 500 (bottom)
SPAC Index Absolute (top) and Relative to the S&P 500 (bottom)

The key takeaway from these charts is not just the degree of the upside but the magnitude of the reversal that happens when the bubble bursts and bloom falls of the rose, or the fried chicken gets soggy… which brings us to Korea.
Like a bright red “you’re here” star on a map, the following article revealed just where we are in the froth cycle for global risk appetite.
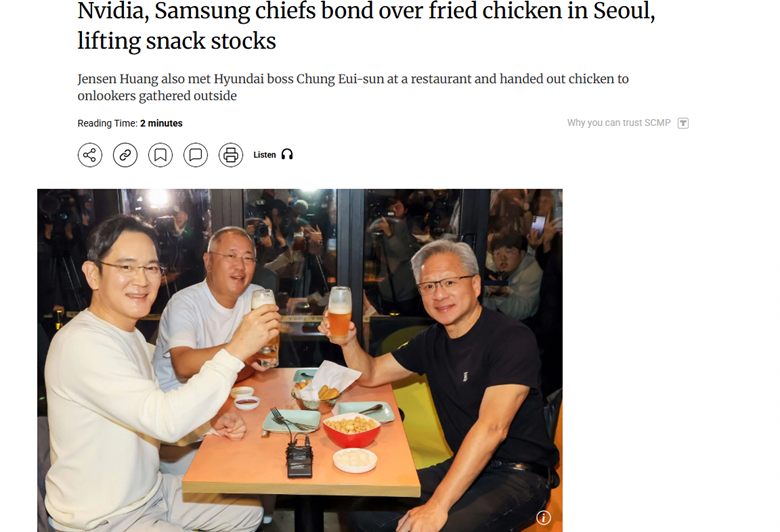
The Bloomberg article details how a simple photo of NVDA Chief, Jensen Huang, enjoying fried chicken and beer with the CEO of Hyundai, sparked limit-up rallies in Korean fried chicken restaurants and poultry producers (we wonder if they were listening to Zac Brown Band while munching, but we highly doubt that was the case).
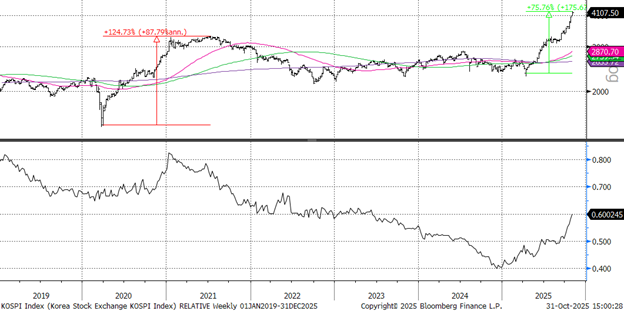
Now, it is not new that Korean stocks trade with a “casino capitalism” bent, with Korean retail investors driving massive-yet-ephemeral rallies in all kinds of “of-the-moment” stocks, however, we are seeing a broader rally in Korean shares that is rivaling the last time we saw a speculative boom back in 2020-2021 (just like in the US!).
South Korea Kospi Absolute (top) and Relative to the S&P 500 (bottom)
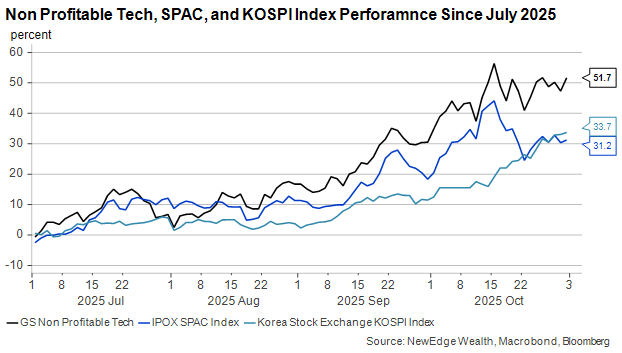
The fascinating, but not surprising, thing about all of these charts is that when you zoom in on 2025, you can see that the pace of price upside began to accelerate in September. September, which was broadly expected to be a weaker month of returns given seasonality statistics, ended up being the start of a powerful run in broad stocks, particularly the most speculative and liquidity-sensitive portions of the market.
This acceleration in the “chicken fried” rally appears likely to have been set off by the Fed starting its cutting cycle, and there being a dearth of economic data to spark concern that the Fed was cutting because the economy was weak (ignorance is bliss, after all). Instead, resilient corporate profits and a continued (circular) wave of AI deals amplified this liquidity-fueled optimism.
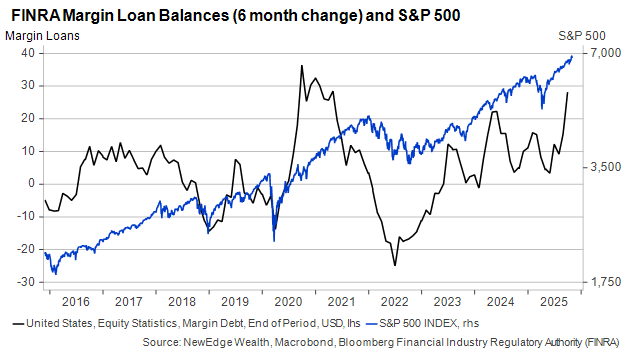
One way to see this in action is the growth of FINRA Margin Loan Balances. The chart below shows the 6-month change in this leverage, noting the sharp acceleration in the last few months. With margin loans tending to be floating rate, the prospect of a lower cost of funding as the Fed cuts appears to have encouraged a sharp rise in borrowing, now growing at the fastest pace since 2020.
This suggests that, as we debate how and when the Fed will cut rates further, these speculative areas of the market are likely to be most sensitive to the degree of rate cuts being priced because they benefited the most from the expectation of deeper cuts to come since September.
Just like there is nothing rational about a new NYC country-themed bar charging $10k+ for a table so revelers in ironic cowboy boots can scream-sing along to “Chicken Fried”, there is nothing rational about the stellar performance of speculative, revenue-less, profit-less, and Korean fried chicken stocks in 2025.
Moves of this magnitude in low-quality parts of the market are exactly why Quality as a factor for long-term equity investors can be such a powerful way to compound returns in the long run (this great 2023 white paper from Jay Peters details the merits and characteristics of quality investing). By staying disciplined with Quality and not “chasing the hot dot” in speculative booms, long-term investors have the opportunity to participate in market upside while reducing the risk of outsized drawdowns that are a feature of low-quality investing (as seen in the long-term charts included above).
How long this speculative cycle can last is unknown (we constantly return to the great Bob Farrell’s line “Exponential, rapidly rising or falling markets usually go further than you think, but they do not correct by going sideways”), but we will be watching for signs of fading liquidity (this Michael Howell interview is flagging signs of Fed liquidity tightening despite the rate cuts and end to QT) as a key component of how long this “chicken fried” season for stocks can last.
For now, don’t forget to enjoy the little things in life (just maybe not in your portfolio!).
IMPORTANT DISCLOSURES
The views and opinions included in these materials belong to their author and do not necessarily reflect the views and opinions of NewEdge Capital Group, LLC.
This information is general in nature and has been prepared solely for informational and educational purposes and does not constitute an offer or a recommendation to buy or sell any particular security or to adopt any specific investment strategy.
NewEdge and its affiliates do not render advice on legal, tax and/or tax accounting matters. You should consult your personal tax and/or legal advisor to learn about any potential tax or other implications that may result from acting on a particular recommendation.
The trademarks and service marks contained herein are the property of their respective owners. Unless otherwise specifically indicated, all information with respect to any third party not affiliated with NewEdge has been provided by, and is the sole responsibility of, such third party and has not been independently verified by NewEdge, its affiliates or any other independent third party. No representation is given with respect to its accuracy or completeness, and such information and opinions may change without notice.
Investing involves risk, including possible loss of principal. Past performance is no guarantee of future results.
Any forward-looking statements or forecasts are based on assumptions and actual results are expected to vary from any such statements or forecasts. No assurance can be given that investment objectives or target returns will be achieved. Future returns may be higher or lower than the estimates presented herein.
An investment cannot be made directly in an index. Indices are unmanaged and have no fees or expenses. You can obtain information about many indices online at a variety of sources including: https://www.sec.gov/answers/indices.htm.
All data is subject to change without notice.
© 2025 NewEdge Capital Group, LLC
The post Chicken Fried appeared first on NewEdge Wealth.


